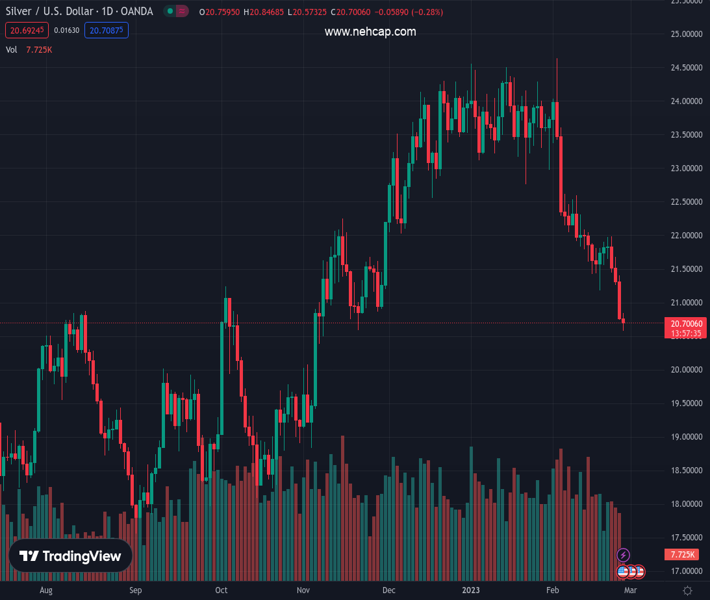
#XAGUSD @ 20.678 Silver continues losing ground for the fourth straight day and refreshes the YTD low on Monday. (Pivot Orderbook analysis)
…
This is a premium post.
[s2If !current_user_can(access_s2member_level4)]Please register for PREMIUM VERSION HERE to read full post below containing analysis. In case of any error or you think you are not able to read the full post below, please email us at support#nehcap.com [lwa][/s2If] [s2If current_user_can(access_s2member_level4)]
- Silver continues losing ground for the fourth straight day and refreshes the YTD low on Monday.
- Oversold oscillators on the daily chart help the XAG/USD to find support near the 61.8% Fibo.
- The setup still favours bearish traders and supports prospects for a further depreciating move.
The pair currently trades last at 20.678.
The previous day high was 21.4 while the previous day low was 20.74. The daily 38.2% Fib levels comes at 20.99, expected to provide resistance. Similarly, the daily 61.8% fib level is at 21.15, expected to provide resistance.
Silver remains under some selling pressure for the fourth successive day and drops to a fresh YTD low during the first half of trading on Monday. The white metal currently trades just above the mid-$20.00s and seems vulnerable to prolonging the recent downfall witnessed since the beginning of this month.
Friday’s convincing break and acceptance below a technically significant 200-day Simple Moving Average (SMA) adds credence to the negative outlook. That said, oscillators on the daily chart are flashing extremely oversold conditions, making it prudent to wait for some consolidation or a modest rebound before positioning for further losses.
Any attempted recovery, however, is more likely to meet with a fresh supply near the $21.00 mark. This, in turn, should cap the XAG/USD near the $21.30-$21.35 region, marking the 50% Fibonacci retracement level of the rally from October 2022. The latter should act as a pivotal point, which if cleared could prompt some near-term short-covering.
Bearish traders, meanwhile, take a breather near the 61.8% Fibo. level, below which the XAG/USD could accelerate the fall towards challenging the $20.00 psychological mark. The white metal could eventually drop to the $19.75-$19.70 intermediate support en route to the $19.15 horizontal zone and the $19.00 round-figure mark.
Technical Levels: Supports and Resistances
XAGUSD currently trading at 20.66 at the time of writing. Pair opened at 20.76 and is trading with a change of -0.48 % .
| Overview | Overview.1 | |
|---|---|---|
| 0 | Today last price | 20.66 |
| 1 | Today Daily Change | -0.10 |
| 2 | Today Daily Change % | -0.48 |
| 3 | Today daily open | 20.76 |
The pair remains strongly bearish on the daily time frame. It trades below the 20 SMA @ 22.2, 50 SMA 23.14, 100 SMA @ 22.02 and 200 SMA @ 21.01.
| Trends | Trends.1 | |
|---|---|---|
| 0 | Daily SMA20 | 22.20 |
| 1 | Daily SMA50 | 23.14 |
| 2 | Daily SMA100 | 22.02 |
| 3 | Daily SMA200 | 21.01 |
The previous day high was 21.4 while the previous day low was 20.74. The daily 38.2% Fib levels comes at 20.99, expected to provide resistance. Similarly, the daily 61.8% fib level is at 21.15, expected to provide resistance.
Note the levels of interest below:
- Pivot support is noted at 20.53, 20.31, 19.87
- Pivot resistance is noted at 21.2, 21.63, 21.86
| Levels | Levels.1 |
|---|---|
| Previous Daily High | 21.40 |
| Previous Daily Low | 20.74 |
| Previous Weekly High | 21.98 |
| Previous Weekly Low | 20.74 |
| Previous Monthly High | 24.55 |
| Previous Monthly Low | 22.76 |
| Daily Fibonacci 38.2% | 20.99 |
| Daily Fibonacci 61.8% | 21.15 |
| Daily Pivot Point S1 | 20.53 |
| Daily Pivot Point S2 | 20.31 |
| Daily Pivot Point S3 | 19.87 |
| Daily Pivot Point R1 | 21.20 |
| Daily Pivot Point R2 | 21.63 |
| Daily Pivot Point R3 | 21.86 |
[/s2If]
Join Our Telegram Group
")


