WTI prints mild losses to probe the previous rebound from three-week low. (Pivot Orderbook analysis)
…
This is a premium post.
[s2If !current_user_can(access_s2member_level4)]Please register for PREMIUM VERSION HERE to read full post below containing analysis. In case of any error or you think you are not able to read the full post below, please email us at support#nehcap.com [lwa][/s2If] [s2If current_user_can(access_s2member_level4)]
- WTI prints mild losses to probe the previous rebound from three-week low.
- Russia’s halt of Oil supplies to Poland joins more Western sanctions on Moscow to highlight geopolitical woes.
- US SPR woes challenge energy buyers amid hawkish central bank concerns.
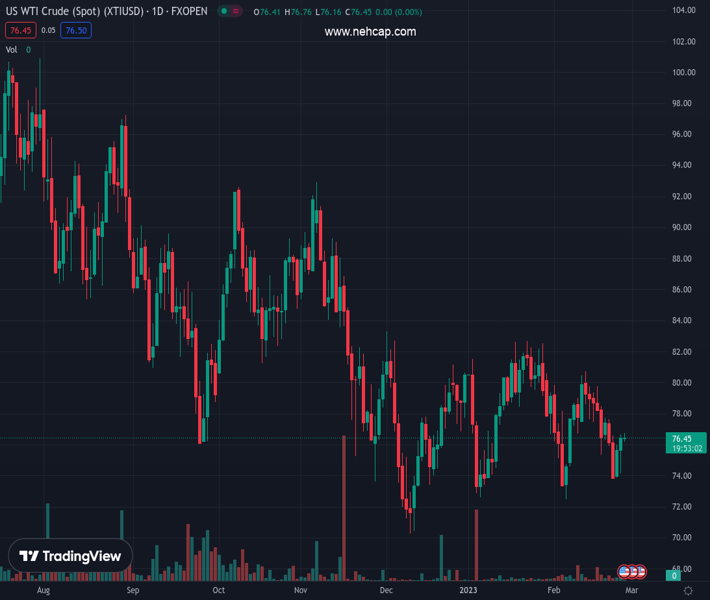
The pair currently trades last at 76.47.
The previous day high was 76.66 while the previous day low was 74.15. The daily 38.2% Fib levels comes at 75.7, expected to provide support. Similarly, the daily 61.8% fib level is at 75.11, expected to provide support.
WTI crude oil fades the previous weekly rebound as it retreats to $76.50 while printing mild losses during early Monday. In doing so, the black gold struggles to justify geopolitical fears emanating from Russia, as well as fail to cheer a pullback in the US Dollar, amid hawkish central bank concerns.
That said, Politico reports fresh sanctions on Russia from the US and the UK, as well as the European Union (EU states) after a clash between Poland and Italy held up the process for days. On the other hand, Reuters came out with the news suggesting Russia’s halting of oil flow to Poland via the Druzhba pipeline.
It should be noted that the recently firmer statistics from the developed economies allowed their respective central banks to defend the hawkish bias and suggest more rate hikes, even as recession fears loom. The same challenges the energy prices amid fears of low demand in the future.
Also weighing on the energy prices could the US President Joe Biden’s readiness to ease control of the Strategic Petroleum Reserves (SPR) to tame the oil shortage.
Additionally, the US Dollar’s strength exerts downside pressure on the energy benchmark, despite the latest pullback from the seven-week high.
Moving on, the weekly Oil inventory numbers from the American Petroleum Institute (API) and the Energy Information Administration (EIA) could entertain Oil traders but major attention will be given to the risk catalysts for clear directions. That said, the chatter surrounding the hidden alliance between Russia and China could keep Oil buyers hopeful.
A daily closing beyond a two-week-old descending resistance line, around $27.30 by the press time, becomes necessary for the WTI crude oil buyers to keep the reins.
Technical Levels: Supports and Resistances
XTIUSD currently trading at 76.47 at the time of writing. Pair opened at 76.64 and is trading with a change of -0.22% % .
| Overview | Overview.1 | |
|---|---|---|
| 0 | Today last price | 76.47 |
| 1 | Today Daily Change | -0.17 |
| 2 | Today Daily Change % | -0.22% |
| 3 | Today daily open | 76.64 |
The pair remains strongly bearish on the daily time frame. It trades below the 20 SMA @ 77.22, 50 SMA 78.02, 100 SMA @ 80.25 and 200 SMA @ 88.6.
| Trends | Trends.1 | |
|---|---|---|
| 0 | Daily SMA20 | 77.22 |
| 1 | Daily SMA50 | 78.02 |
| 2 | Daily SMA100 | 80.25 |
| 3 | Daily SMA200 | 88.60 |
The previous day high was 76.66 while the previous day low was 74.15. The daily 38.2% Fib levels comes at 75.7, expected to provide support. Similarly, the daily 61.8% fib level is at 75.11, expected to provide support.
Note the levels of interest below:
- Pivot support is noted at 74.97, 73.31, 72.47
- Pivot resistance is noted at 77.48, 78.32, 79.98
| Levels | Levels.1 |
|---|---|
| Previous Daily High | 76.66 |
| Previous Daily Low | 74.15 |
| Previous Weekly High | 77.75 |
| Previous Weekly Low | 73.86 |
| Previous Monthly High | 82.68 |
| Previous Monthly Low | 72.64 |
| Daily Fibonacci 38.2% | 75.70 |
| Daily Fibonacci 61.8% | 75.11 |
| Daily Pivot Point S1 | 74.97 |
| Daily Pivot Point S2 | 73.31 |
| Daily Pivot Point S3 | 72.47 |
| Daily Pivot Point R1 | 77.48 |
| Daily Pivot Point R2 | 78.32 |
| Daily Pivot Point R3 | 79.98 |
[/s2If]
Join Our Telegram Group
")


