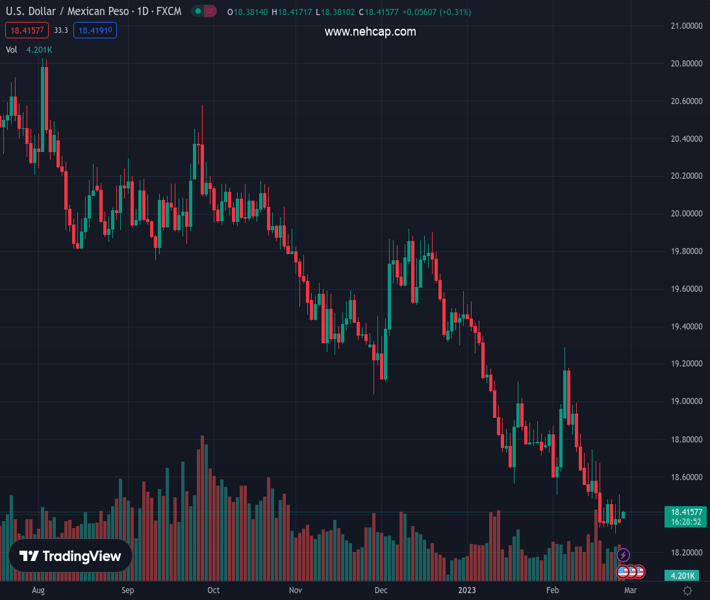
#USDMXN @ 18.4166 retreats from intraday high, fails to extend the previous week’s rebound from the lowest levels since April 2018. (Pivot Orderbook analysis)
…
This is a premium post.
[s2If !current_user_can(access_s2member_level4)]Please register for PREMIUM VERSION HERE to read full post below containing analysis. In case of any error or you think you are not able to read the full post below, please email us at support#nehcap.com [lwa][/s2If] [s2If current_user_can(access_s2member_level4)]
- USD/MXN retreats from intraday high, fails to extend the previous week’s rebound from the lowest levels since April 2018.
- US Dollar struggles for clear directions after posting the heaviest run-up since September 2022 amid hawkish Fed concerns.
- Mixed risk catalysts, sluggish bond markets keep Mexican Peso illiquid ahead of US Durable Goods Orders.
The pair currently trades last at 18.4166.
The previous day high was 18.5056 while the previous day low was 18.3526. The daily 38.2% Fib levels comes at 18.4471, expected to provide resistance. Similarly, the daily 61.8% fib level is at 18.411, expected to provide support.
USD/MXN aptly portrays the market’s inaction during early Monday as the Mexican Peso (MXN) pair seesaws around $18.40, after bouncing off the lowest levels in nearly five years.
In doing so, the USD/MXN pair seesaws around the intraday high as the US Dollar seeks the next catalyst to extend the previous week’s run-up. It should be noted that the upbeat US data, mainly surrounding inflation, joined hawkish Fed talks and upbeat Treasury bond yields to underpin the US Dollar’s biggest weekly run-up since September 2022 the last week. That said, the US Dollar Index (DXY) renews its intraday high around 105.30 following the initial pullback from a seven-week high. In doing so, the greenback’s gauge versus the six major currencies remains firmer for the fifth consecutive day.
Mixed concerns surrounding Russia and mildly offered Oil price seems to challenge the USD/MXN traders amid a light calendar ahead of the US Durable Goods Orders for January, expected -4.0% versus 5.6% prior.
Adding strength to the market’s inaction are the dicey US Treasury bond yields. While tracing the same, the US 10-year Treasury yields reverse the early-day losses to around 3.95%. Further, the two-year counterparts jump back towards the highest levels since November 2022, marked the previous day, as bond bears poke the 4.83% level by the press time.
Against this backdrop, t the S&P 500 Futures lick its wounds with mild gains after the Wall Street benchmark posted the biggest weekly slump of 2023.
At home, hawkish concerns after Banxico’s latest 0.50% rate hike keep the USD/MXN bears hopeful.
Moving on, US PMIs for February and second-tier data from Mexico will entertain USD/MXN traders amid an anticipated corrective bounce.
Thursday’s Doji near multi-month low joins oversold RSI (14) to suggest corrective bounce in the USD/MXN prices. However, buyers remain off the table unless witnessing sustained trading beyond January’s low surrounding $18.56.
Technical Levels: Supports and Resistances
USDMXN currently trading at 18.4069 at the time of writing. Pair opened at 18.41 and is trading with a change of -0.02% % .
| Overview | Overview.1 | |
|---|---|---|
| 0 | Today last price | 18.4069 |
| 1 | Today Daily Change | -0.0031 |
| 2 | Today Daily Change % | -0.02% |
| 3 | Today daily open | 18.41 |
The pair remains strongly bearish on the daily time frame. It trades below the 20 SMA @ 18.6419, 50 SMA 18.9578, 100 SMA @ 19.3072 and 200 SMA @ 19.7217.
| Trends | Trends.1 | |
|---|---|---|
| 0 | Daily SMA20 | 18.6419 |
| 1 | Daily SMA50 | 18.9578 |
| 2 | Daily SMA100 | 19.3072 |
| 3 | Daily SMA200 | 19.7217 |
The previous day high was 18.5056 while the previous day low was 18.3526. The daily 38.2% Fib levels comes at 18.4471, expected to provide resistance. Similarly, the daily 61.8% fib level is at 18.411, expected to provide support.
Note the levels of interest below:
- Pivot support is noted at 18.3399, 18.2698, 18.187
- Pivot resistance is noted at 18.4929, 18.5757, 18.6458
| Levels | Levels.1 |
|---|---|
| Previous Daily High | 18.5056 |
| Previous Daily Low | 18.3526 |
| Previous Weekly High | 18.5056 |
| Previous Weekly Low | 18.2984 |
| Previous Monthly High | 19.5361 |
| Previous Monthly Low | 18.5663 |
| Daily Fibonacci 38.2% | 18.4471 |
| Daily Fibonacci 61.8% | 18.4110 |
| Daily Pivot Point S1 | 18.3399 |
| Daily Pivot Point S2 | 18.2698 |
| Daily Pivot Point S3 | 18.1870 |
| Daily Pivot Point R1 | 18.4929 |
| Daily Pivot Point R2 | 18.5757 |
| Daily Pivot Point R3 | 18.6458 |
[/s2If]
Join Our Telegram Group
")


