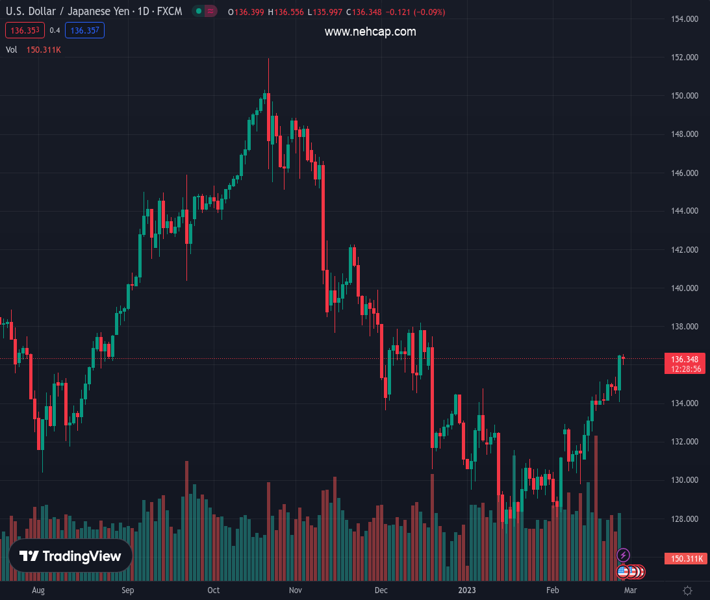
#USDJPY @ 136.355 eases from a fresh YTD peak touched on Monday amid a modest USD downtick. (Pivot Orderbook analysis)
…
This is a premium post.
[s2If !current_user_can(access_s2member_level4)]Please register for PREMIUM VERSION HERE to read full post below containing analysis. In case of any error or you think you are not able to read the full post below, please email us at support#nehcap.com [lwa][/s2If] [s2If current_user_can(access_s2member_level4)]
- USD/JPY eases from a fresh YTD peak touched on Monday amid a modest USD downtick.
- The Fed-BoJ policy divergence acts as a tailwind for the pair and helps limit the downside.
- Investors now look forward to the US macro data to grab short-term trading opportunities.
The pair currently trades last at 136.355.
The previous day high was 136.52 while the previous day low was 134.06. The daily 38.2% Fib levels comes at 135.58, expected to provide support. Similarly, the daily 61.8% fib level is at 135.0, expected to provide support.
The USD/JPY pair corrects from a fresh YTD top touched earlier this Monday and remains on the defensive through the first half of the European session. Spot prices, however, manage to hold above the 136.00 mark and seem poised to prolong the recent upward trajectory witnessed since the beginning of this month.
A softer tone surrounding the US Treasury bond yields trigger a modest US Dollar pullback from a seven-week high, which, in turn, is seen exerting some downward pressure on the USD/JPY pair. That said, a combination of factors acts as a tailwind for the major and helps limit the downside, warranting some caution before positioning for any meaningful depreciating move.
The Japanese Yen (JPY) is weighed down by dovish remarks from the incoming Bank of Japan (BoJ) Governor Kazuo Ueda, stressing the need to maintain the ultra-loose policy to support the fragile economy. Ueda further added that it is possible to push up prices and wages with monetary easing. This, along with a modest recovery in the US equity futures, undermines the safe-haven JPY.
Apart from this, expectations that the Federal Reserve will stick to its hawkish stance should act as a tailwind for the US bond yields and lend some support to the Greenback. Meanwhile, the divergent Fed-BoJ policy outlook supports prospects for the emergence of some dip-buying at lower levels and suggests that the path of least resistance for spot prices is to the upside.
Market participants now look forward to the US economic docket, featuring the release of Durable Goods Orders and Pending Home Sales data later during the early North American session. This, along with the US bond yields, will influence the USD price dynamics. Traders will further take cues from the broader risk sentiment to grab short-term opportunities around the USD/JPY pair.
Technical Levels: Supports and Resistances
USDJPY currently trading at 136.29 at the time of writing. Pair opened at 136.42 and is trading with a change of -0.1 % .
| Overview | Overview.1 | |
|---|---|---|
| 0 | Today last price | 136.29 |
| 1 | Today Daily Change | -0.13 |
| 2 | Today Daily Change % | -0.10 |
| 3 | Today daily open | 136.42 |
The pair is trading above its 20 Daily moving average @ 132.51, above its 50 Daily moving average @ 131.79 , below its 100 Daily moving average @ 137.16 and below its 200 Daily moving average @ 137.09
| Trends | Trends.1 | |
|---|---|---|
| 0 | Daily SMA20 | 132.51 |
| 1 | Daily SMA50 | 131.79 |
| 2 | Daily SMA100 | 137.16 |
| 3 | Daily SMA200 | 137.09 |
The previous day high was 136.52 while the previous day low was 134.06. The daily 38.2% Fib levels comes at 135.58, expected to provide support. Similarly, the daily 61.8% fib level is at 135.0, expected to provide support.
Note the levels of interest below:
- Pivot support is noted at 134.81, 133.2, 132.35
- Pivot resistance is noted at 137.27, 138.13, 139.73
| Levels | Levels.1 |
|---|---|
| Previous Daily High | 136.52 |
| Previous Daily Low | 134.06 |
| Previous Weekly High | 136.52 |
| Previous Weekly Low | 133.92 |
| Previous Monthly High | 134.78 |
| Previous Monthly Low | 127.22 |
| Daily Fibonacci 38.2% | 135.58 |
| Daily Fibonacci 61.8% | 135.00 |
| Daily Pivot Point S1 | 134.81 |
| Daily Pivot Point S2 | 133.20 |
| Daily Pivot Point S3 | 132.35 |
| Daily Pivot Point R1 | 137.27 |
| Daily Pivot Point R2 | 138.13 |
| Daily Pivot Point R3 | 139.73 |
[/s2If]
Join Our Telegram Group
")


