#USDJPY @ 136.352 BoJ Ueda sees the current monetary policy as appropriate to achieve the 2% inflation target confidently. (Pivot Orderbook analysis)
…
This is a premium post.
[s2If !current_user_can(access_s2member_level4)]Please register for PREMIUM VERSION HERE to read full post below containing analysis. In case of any error or you think you are not able to read the full post below, please email us at support#nehcap.com [lwa][/s2If] [s2If current_user_can(access_s2member_level4)]
- BoJ Ueda sees the current monetary policy as appropriate to achieve the 2% inflation target confidently.
- USD/JPY has delivered a breakout of the Inverted H&S pattern that conveys a bullish reversal.
- An oscillating in the bullish range of 60.00-80.00 by the RSI (14) indicates more upside ahead.
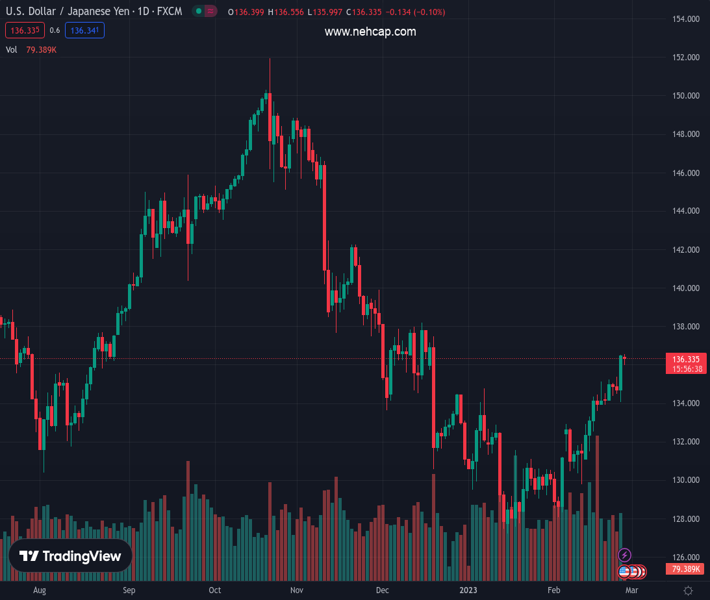
The pair currently trades last at 136.352.
The previous day high was 136.52 while the previous day low was 134.06. The daily 38.2% Fib levels comes at 135.58, expected to provide support. Similarly, the daily 61.8% fib level is at 135.0, expected to provide support.
The USD/JPY pair is struggling to extend recovery above the immediate resistance of 136.40 in the early European session. The asset has turned sideways as investors are awaiting the release of the United States Durable Goods Orders data for fresh cues. The US Dollar Index (DXY) has faced barricades around 104.90 but is expected to continue its upside to near the 105.00 resistance as investors’ risk appetite has faded dramatically.
Meanwhile, dovish commentary from Bank of Japan (BoJ) Governor Nominee Kazuo Ueda is impacting the Japanese Yen. BoJ Ueda sees the current monetary policy as appropriate to achieve the 2% inflation target confidently.
USD/JPY has delivered a breakout of the Inverted Head and Shoulder chart pattern on a four-hour scale that conveys a bullish reversal after a prolonged consolidation. The impulse of the asset has turned bullish after a confident break above the horizontal resistance plotted from December 28 high at 134.50.
The US Dollar bulls are getting strength from the 50-period Exponential Moving Average (EMA) at 134.60.
An oscillating in the bullish range of 60.00-80.00 by the Relative Strength Index (RSI) (14) indicates a continuation of the upside.
Should the asset break above the intraday high at 136.56, US Dollar bulls will drive the asset toward December 12 high at 137.48 followed by the horizontal resistance placed from December 15 high at 138.18.
Alternatively, a confident break below February 16 low at 133.60 will negate the Inverted H&S formation and will drag the asset toward February 6 high around 133.00 and February 10 high at 131.65.
Technical Levels: Supports and Resistances
USDJPY currently trading at 136.34 at the time of writing. Pair opened at 136.42 and is trading with a change of -0.06 % .
| Overview | Overview.1 | |
|---|---|---|
| 0 | Today last price | 136.34 |
| 1 | Today Daily Change | -0.08 |
| 2 | Today Daily Change % | -0.06 |
| 3 | Today daily open | 136.42 |
The pair is trading above its 20 Daily moving average @ 132.51, above its 50 Daily moving average @ 131.79 , below its 100 Daily moving average @ 137.16 and below its 200 Daily moving average @ 137.09
| Trends | Trends.1 | |
|---|---|---|
| 0 | Daily SMA20 | 132.51 |
| 1 | Daily SMA50 | 131.79 |
| 2 | Daily SMA100 | 137.16 |
| 3 | Daily SMA200 | 137.09 |
The previous day high was 136.52 while the previous day low was 134.06. The daily 38.2% Fib levels comes at 135.58, expected to provide support. Similarly, the daily 61.8% fib level is at 135.0, expected to provide support.
Note the levels of interest below:
- Pivot support is noted at 134.81, 133.2, 132.35
- Pivot resistance is noted at 137.27, 138.13, 139.73
| Levels | Levels.1 |
|---|---|
| Previous Daily High | 136.52 |
| Previous Daily Low | 134.06 |
| Previous Weekly High | 136.52 |
| Previous Weekly Low | 133.92 |
| Previous Monthly High | 134.78 |
| Previous Monthly Low | 127.22 |
| Daily Fibonacci 38.2% | 135.58 |
| Daily Fibonacci 61.8% | 135.00 |
| Daily Pivot Point S1 | 134.81 |
| Daily Pivot Point S2 | 133.20 |
| Daily Pivot Point S3 | 132.35 |
| Daily Pivot Point R1 | 137.27 |
| Daily Pivot Point R2 | 138.13 |
| Daily Pivot Point R3 | 139.73 |
[/s2If]
Join Our Telegram Group
")


