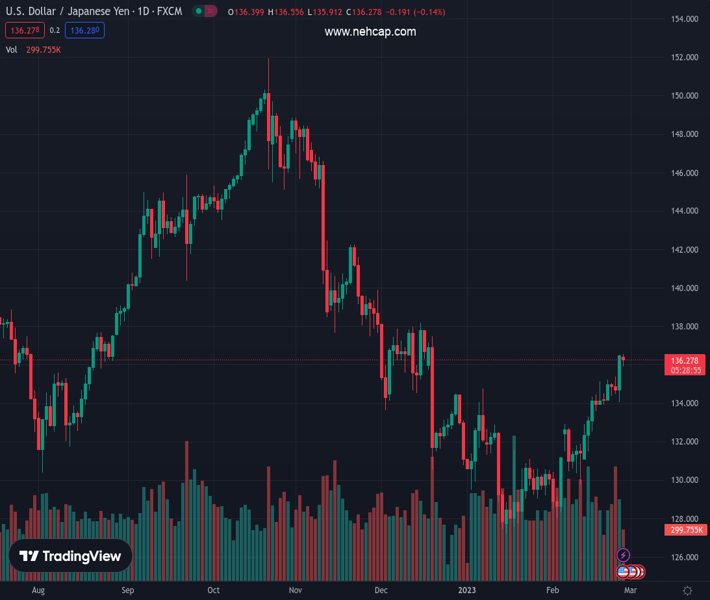
#USDJPY @ 136.281 The printed a new YTD high and would test 137.00, achieving a daily close above 136.00. (Pivot Orderbook analysis)
…
This is a premium post.
[s2If !current_user_can(access_s2member_level4)]Please register for PREMIUM VERSION HERE to read full post below containing analysis. In case of any error or you think you are not able to read the full post below, please email us at support#nehcap.com [lwa][/s2If] [s2If current_user_can(access_s2member_level4)]
- The USD/JPY printed a new YTD high and would test 137.00, achieving a daily close above 136.00.
- The 20-DMA crossing above the 50-DMA exacerbated the USD/JPY Friday’s rally above 136.00.
The pair currently trades last at 136.281.
The previous day high was 136.52 while the previous day low was 134.06. The daily 38.2% Fib levels comes at 135.58, expected to provide support. Similarly, the daily 61.8% fib level is at 135.0, expected to provide support.
The USD/JPY drops from around YTD highs around 136.55 and hits a daily low of 135.91 before reclaiming the 136.00 figure on Monday. At the time of typing, the USD/JPY falls 0.29%, trading at around 136.20s, underpinned by US bond yields, namely the 10-year benchmark note rate, down three basis points (bps) at 3.918%.
After breaking the year’s previous high at 134.77, the USD/JPY printed another leg-up to the new YTD high at 136.55 before aiming toward the current spot price. From a technical perspective, the USD/JPY is still upward biased, backed by the Relative Strength Index IRSI) in bullish territory and the Rate of Change (RoC), suggesting that in the last three days, buyers have emerged.
Also, the 100-day Exponential Moving Average (EMA) was the last solid resistance level at 134.79, which, once conquered, exacerbated a 160 pip rally to the new YTD high. Traders should be aware that the 20=day EMA at 133.46 crossed above the 50-day EMA at 133.36. Hence, the USD/JPY could accelerate as the 20-day EMA closes the 200-day EMA At 133.86.
As the USD/JPY path of least resistance is upwards, the pair’s next ceiling level would be the 137.00 figure. Break above will expose the December 20 daily high of 137.47 before putting into play the December 15 high at 138.02. As an alternate scenario, the USD/JPY first support would be the 136.00 figure, ahead of today’s low at 135.91.
Technical Levels: Supports and Resistances
USDJPY currently trading at 136.19 at the time of writing. Pair opened at 136.42 and is trading with a change of -0.17 % .
| Overview | Overview.1 | |
|---|---|---|
| 0 | Today last price | 136.19 |
| 1 | Today Daily Change | -0.23 |
| 2 | Today Daily Change % | -0.17 |
| 3 | Today daily open | 136.42 |
The pair is trading above its 20 Daily moving average @ 132.51, above its 50 Daily moving average @ 131.79 , below its 100 Daily moving average @ 137.16 and below its 200 Daily moving average @ 137.09
| Trends | Trends.1 | |
|---|---|---|
| 0 | Daily SMA20 | 132.51 |
| 1 | Daily SMA50 | 131.79 |
| 2 | Daily SMA100 | 137.16 |
| 3 | Daily SMA200 | 137.09 |
The previous day high was 136.52 while the previous day low was 134.06. The daily 38.2% Fib levels comes at 135.58, expected to provide support. Similarly, the daily 61.8% fib level is at 135.0, expected to provide support.
Note the levels of interest below:
- Pivot support is noted at 134.81, 133.2, 132.35
- Pivot resistance is noted at 137.27, 138.13, 139.73
| Levels | Levels.1 |
|---|---|
| Previous Daily High | 136.52 |
| Previous Daily Low | 134.06 |
| Previous Weekly High | 136.52 |
| Previous Weekly Low | 133.92 |
| Previous Monthly High | 134.78 |
| Previous Monthly Low | 127.22 |
| Daily Fibonacci 38.2% | 135.58 |
| Daily Fibonacci 61.8% | 135.00 |
| Daily Pivot Point S1 | 134.81 |
| Daily Pivot Point S2 | 133.20 |
| Daily Pivot Point S3 | 132.35 |
| Daily Pivot Point R1 | 137.27 |
| Daily Pivot Point R2 | 138.13 |
| Daily Pivot Point R3 | 139.73 |
[/s2If]
Join Our Telegram Group
")


