#USDCHF @ 0.93560 is likely to display a volatility contraction ahead of Swiss GDP and US Manufacturing PMI data. (Pivot Orderbook analysis)
…
This is a premium post.
[s2If !current_user_can(access_s2member_level4)]Please register for PREMIUM VERSION HERE to read full post below containing analysis. In case of any error or you think you are not able to read the full post below, please email us at support#nehcap.com [lwa][/s2If] [s2If current_user_can(access_s2member_level4)]
- USD/CHF is likely to display a volatility contraction ahead of Swiss GDP and US Manufacturing PMI data.
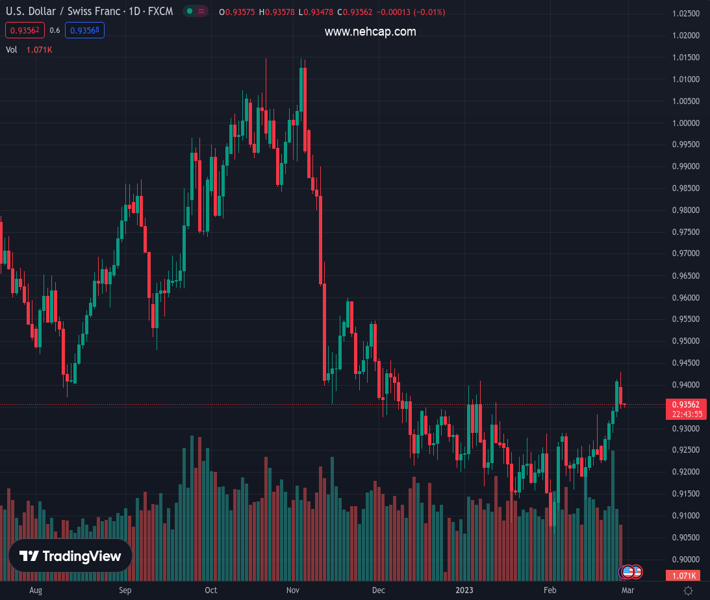
- The Swiss Franc asset has struggled in extending recovery above the horizontal resistance placed around 0.9410.
- A slippage from the RSI (14) into the 40.00-60.00 range indicates a loss in the upside momentum.
The pair currently trades last at 0.93560.
The previous day high was 0.9409 while the previous day low was 0.9326. The daily 38.2% Fib levels comes at 0.9377, expected to provide resistance. Similarly, the daily 61.8% fib level is at 0.9357, expected to provide resistance.
The USD/CHF pair is building an intermediate cushion around 0.9350 after a steep correction from above 0.9420 in the early Tokyo session. The Swiss franc asset is expected to turn sideways ahead of the release of the Swiss Gross Domestic Product (GDP) (Q4) and United States ISM Manufacturing PMI data.
On an annualized basis, Swiss GDP is expected to report a contraction of 1.2% vs. an expansion of 0.5% released earlier. As per the consensus, the Swiss economy is expanded by 0.3% in Q4, higher than the 0.2% growth delivered in Q3.
The US ISM Manufacturing PMI is expected to improve to 48.0 from the former release of 47.4. A figure below 50.0 is considered a contraction in activities. Therefore, it would be worth calling it a decline in contraction.
A rebound in the risk appetite of the market participants resulted in a revival for S&P500 after diving last week. The US Dollar Index (DXY) is expected to display a volatility contraction around 104.20.
USD/CHF has corrected after struggling to extend recovery above the horizontal resistance placed from January 6 high around 0.9410. Earlier, the Swiss Franc asset delivered a breakout of the resistance plotted from January 31 high at around 0.9290, which resulted in a bullish reversal. The major is expected to display a volatility contraction pattern before printing a fresh upside.
Advancing 20-and 50-period Exponential Moving Averages (EMAs) at 0.9361 and 0.9316 respectively, add to the upside filters.
The Relative Strength Index (RSI) (14) has slipped into the 40.00-60.00 range from the bullish range of 60.00-80.00, which indicates a loss in the upside momentum.
For a fresh upside, the asset needs to deliver a break above February 27 high at 0.9429, which will drive the major toward December 6 high at 0.9456 followed by November 25 high around 0.9500.
In an alternate scenario, a breakdown below February 9 low at 0.9161 will drag the asset toward the round-level support at 0.9100. A slippage below the latter will drag the asset toward the February low at 0.9059.
Technical Levels: Supports and Resistances
USDCHF currently trading at 0.9361 at the time of writing. Pair opened at 0.9408 and is trading with a change of -0.5 % .
| Overview | Overview.1 | |
|---|---|---|
| 0 | Today last price | 0.9361 |
| 1 | Today Daily Change | -0.0047 |
| 2 | Today Daily Change % | -0.5000 |
| 3 | Today daily open | 0.9408 |
The pair is trading above its 20 Daily moving average @ 0.9239, above its 50 Daily moving average @ 0.9251 , below its 100 Daily moving average @ 0.9465 and below its 200 Daily moving average @ 0.9573
| Trends | Trends.1 | |
|---|---|---|
| 0 | Daily SMA20 | 0.9239 |
| 1 | Daily SMA50 | 0.9251 |
| 2 | Daily SMA100 | 0.9465 |
| 3 | Daily SMA200 | 0.9573 |
The previous day high was 0.9409 while the previous day low was 0.9326. The daily 38.2% Fib levels comes at 0.9377, expected to provide resistance. Similarly, the daily 61.8% fib level is at 0.9357, expected to provide resistance.
Note the levels of interest below:
- Pivot support is noted at 0.9353, 0.9298, 0.927
- Pivot resistance is noted at 0.9436, 0.9464, 0.9519
| Levels | Levels.1 |
|---|---|
| Previous Daily High | 0.9409 |
| Previous Daily Low | 0.9326 |
| Previous Weekly High | 0.9409 |
| Previous Weekly Low | 0.9221 |
| Previous Monthly High | 0.9410 |
| Previous Monthly Low | 0.9085 |
| Daily Fibonacci 38.2% | 0.9377 |
| Daily Fibonacci 61.8% | 0.9357 |
| Daily Pivot Point S1 | 0.9353 |
| Daily Pivot Point S2 | 0.9298 |
| Daily Pivot Point S3 | 0.9270 |
| Daily Pivot Point R1 | 0.9436 |
| Daily Pivot Point R2 | 0.9464 |
| Daily Pivot Point R3 | 0.9519 |
[/s2If]
Join Our Telegram Group
")


