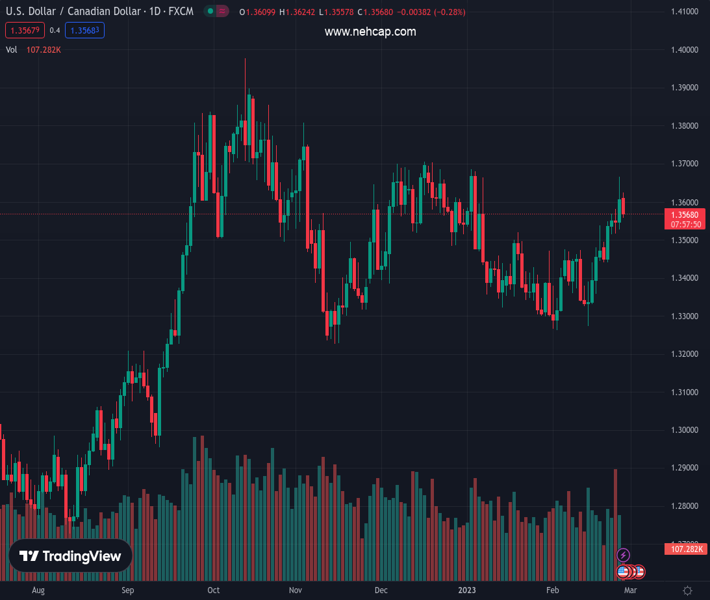
#USDCAD @ 1.35676 retreats further from its highest level since January amid broad-based USD weakness. (Pivot Orderbook analysis)
…
This is a premium post.
[s2If !current_user_can(access_s2member_level4)]Please register for PREMIUM VERSION HERE to read full post below containing analysis. In case of any error or you think you are not able to read the full post below, please email us at support#nehcap.com [lwa][/s2If] [s2If current_user_can(access_s2member_level4)]
- USD/CAD retreats further from its highest level since January amid broad-based USD weakness.
- The risk-on impulse prompts profit-taking around the safe-haven buck and weighs on the major.
- Weaker Oil prices could undermine the Loonie and lend support amid hawkish Fed expectations.
The pair currently trades last at 1.35676.
The previous day high was 1.3666 while the previous day low was 1.3527. The daily 38.2% Fib levels comes at 1.3613, expected to provide resistance. Similarly, the daily 61.8% fib level is at 1.358, expected to provide resistance.
The USD/CAD pair comes under heavy selling pressure on the first day of a new week and retreats further from its highest level since January 6 touched on Friday. The pair maintains its offered tone, around the 1.3565-1.3560 region through the early North American session and reacts little to the mixed US macro data.
The US Census Bureau reported that headline Durable Goods Orders fell by 4.5% in January, down sharply from the previous month’s downwardly revised reading that showed a strong 5.1% growth. The disappointment, however, is offset by orders excluding transportation items, which rose 0.7% during the reported month as compared to a modest 0.1% uptick anticipated and fails to provide any impetus.
That said, a recovery in the global risk sentiment – as depicted by a generally positive tone around the equity markets – continues to weigh on the safe-haven Greenback. This, in turn, is seen as a key factor exerting pressure on the USD/CAD pair, though a combination of factors should help limit deeper losses and warrants some caution before positioning for any further decline.
Crude Oil prices meet with a fresh supply amid worries that rapidly rising borrowing costs will dampen economic growth and dent fuel demand. This could undermine the commodity-linked Loonie. Apart from this, expectations that the Federal Reserve will stick to its hawkish stance in the wake of stubbornly high inflation support prospects for the emergence of some USD dip-buying.
Even from a technical perspective, the USD/CAD pair last week confirmed a breakout through the 100-day Simple Moving Average (SMA), which favours bullish traders. Furthermore, speculations that the Bank of Canada (BoC) will pause the policy-tightening cycle make it prudent to wait for strong follow-through selling to confirm that spot prices have topped out in the near term.
Technical Levels: Supports and Resistances
USDCAD currently trading at 1.357 at the time of writing. Pair opened at 1.3606 and is trading with a change of -0.26 % .
| Overview | Overview.1 | |
|---|---|---|
| 0 | Today last price | 1.3570 |
| 1 | Today Daily Change | -0.0036 |
| 2 | Today Daily Change % | -0.2600 |
| 3 | Today daily open | 1.3606 |
The pair remains strongly bullish on the daily timeframe. It trades above its 20 SMA @ 1.3424, 50 SMA 1.3462, 100 SMA @ 1.3512 and 200 SMA @ 1.3264.
| Trends | Trends.1 | |
|---|---|---|
| 0 | Daily SMA20 | 1.3424 |
| 1 | Daily SMA50 | 1.3462 |
| 2 | Daily SMA100 | 1.3512 |
| 3 | Daily SMA200 | 1.3264 |
The previous day high was 1.3666 while the previous day low was 1.3527. The daily 38.2% Fib levels comes at 1.3613, expected to provide resistance. Similarly, the daily 61.8% fib level is at 1.358, expected to provide resistance.
Note the levels of interest below:
- Pivot support is noted at 1.3534, 1.3462, 1.3396
- Pivot resistance is noted at 1.3672, 1.3738, 1.381
| Levels | Levels.1 |
|---|---|
| Previous Daily High | 1.3666 |
| Previous Daily Low | 1.3527 |
| Previous Weekly High | 1.3666 |
| Previous Weekly Low | 1.3441 |
| Previous Monthly High | 1.3685 |
| Previous Monthly Low | 1.3300 |
| Daily Fibonacci 38.2% | 1.3613 |
| Daily Fibonacci 61.8% | 1.3580 |
| Daily Pivot Point S1 | 1.3534 |
| Daily Pivot Point S2 | 1.3462 |
| Daily Pivot Point S3 | 1.3396 |
| Daily Pivot Point R1 | 1.3672 |
| Daily Pivot Point R2 | 1.3738 |
| Daily Pivot Point R3 | 1.3810 |
[/s2If]
Join Our Telegram Group
")


