US Dollar Index pares the biggest weekly gain since September 2022 at seven-week high. (Pivot Orderbook analysis)
…
This is a premium post.
[s2If !current_user_can(access_s2member_level4)]Please register for PREMIUM VERSION HERE to read full post below containing analysis. In case of any error or you think you are not able to read the full post below, please email us at support#nehcap.com [lwa][/s2If] [s2If current_user_can(access_s2member_level4)]
- US Dollar Index pares the biggest weekly gain since September 2022 at seven-week high.
- Strong inflation-linked data underpin hawkish Fed bias to propel DXY run-up.
- Geopolitical fears add strength to the US Dollar’s haven demand.
- US PMIs, Durable Goods Orders eyed for fresh impulse, Fed talks are the key.
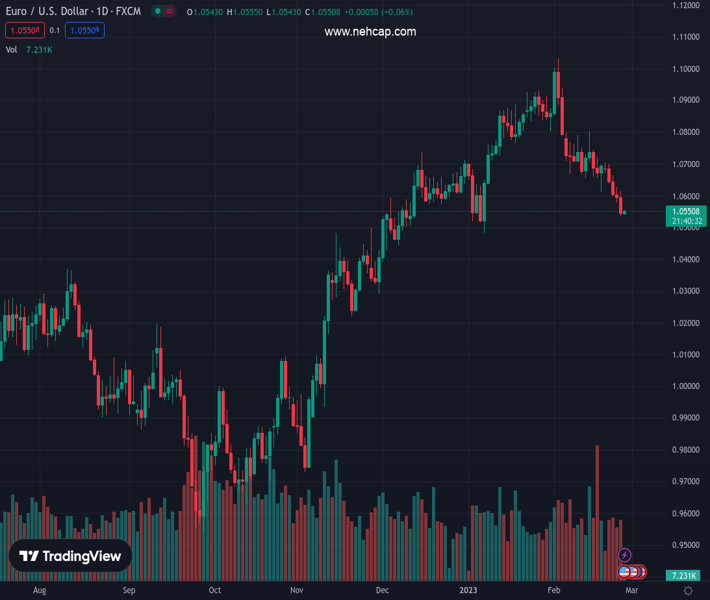
The pair currently trades last at 105.17.
The previous day high was 105.32 while the previous day low was 104.42. The daily 38.2% Fib levels comes at 104.98, expected to provide support. Similarly, the daily 61.8% fib level is at 104.76, expected to provide support.
US Dollar Index (DXY) clings to mild losses around 105.15 as it consolidates recent gains at the highest levels since early January during Monday’s Asian session. That said, the greenback’s gauge versus six major currencies printed the biggest weekly gain since September 2022 in the last, as well as posted the four-week uptrend, before retreating from the 2023 peak marked in early January.
The DXY bulls cheered hawkish Fed bets, as well as the geopolitical fears surrounding China and Russia, while refreshing the multi-day high. However, a lack of major data/events triggered the quote’s latest pullback.
As per the latest read of the FEDWATCH tool, market players price a year-end effective fed funds rate at 5.3%, versus 5.1% signaled by the US central bank in its December meeting. The hawkish Fed concerns could be linked to the strong US data, mainly suggesting strong inflation pressure, as well as the upbeat comments from the US Federal Reserve (Fed) officials.
Among the US data, Friday’s US Personal Consumption Expenditures (PCE) gained major attention as the headline PCE Price Index rose to 5.4% YoY versus 5.3% prior and 4.9% market forecasts. Further, the more relevant Core PCE Price Index, known as Fed’s favorite inflation gauge, rose to 4.7% YoY, compared 4.6% prior and analysts’ forecast of 4.3%.
On the other hand, Cleveland Fed President Loretta Mester told CNBC on Friday that his funds’ rate was above the median in December and still thinks they need to be somewhat above 5%. The policymaker also added that inflation risks still tilted to the upside. Following the suit was Federal Reserve Bank of Boston President Susan Collins who said, “More rate hikes needed to deal with ‘too high’ inflation.” Furthermore, Governor Philip Jefferson said, “Wage growth in the US is running too high to be consistent with a timely and sustainable return to the Federal Reserve’s 2% inflation objective.”
Elsewhere, German and European Union leaders criticized China’s 12-point peace plan and raised the market’s geopolitical fears, which in turn weighed on the market sentiment and propel the US Dollar.
While portraying the mood, Wall Street benchmarks posted the biggest weekly fall in 2023 while the US two-year Treasury bond yields rose to the highest levels since early November 2022.
Looking ahead, this week’s US ISM Manufacturing PMI, Services PMI, Durable Goods Orders and China’s official PMIs will be crucial for the market, as well as for the DXY traders. However, an absence of the US jobs report and a light calendar for the Fed watchers may allow the DXY to pare some of its latest gains.
The US Dollar Index pullback remains elusive unless providing a daily close below the 200-day Exponential Moving Average (EMA) level surrounding 104.85.
Technical Levels: Supports and Resistances
EURUSD currently trading at 105.17 at the time of writing. Pair opened at 105.24 and is trading with a change of -0.07% % .
| Overview | Overview.1 | |
|---|---|---|
| 0 | Today last price | 105.17 |
| 1 | Today Daily Change | -0.07 |
| 2 | Today Daily Change % | -0.07% |
| 3 | Today daily open | 105.24 |
The pair is trading above its 20 Daily moving average @ 103.41, above its 50 Daily moving average @ 103.33 , below its 100 Daily moving average @ 105.24 and below its 200 Daily moving average @ 106.82
| Trends | Trends.1 | |
|---|---|---|
| 0 | Daily SMA20 | 103.41 |
| 1 | Daily SMA50 | 103.33 |
| 2 | Daily SMA100 | 105.24 |
| 3 | Daily SMA200 | 106.82 |
The previous day high was 105.32 while the previous day low was 104.42. The daily 38.2% Fib levels comes at 104.98, expected to provide support. Similarly, the daily 61.8% fib level is at 104.76, expected to provide support.
Note the levels of interest below:
- Pivot support is noted at 104.66, 104.09, 103.76
- Pivot resistance is noted at 105.57, 105.9, 106.47
| Levels | Levels.1 |
|---|---|
| Previous Daily High | 105.32 |
| Previous Daily Low | 104.42 |
| Previous Weekly High | 105.32 |
| Previous Weekly Low | 103.76 |
| Previous Monthly High | 105.63 |
| Previous Monthly Low | 101.50 |
| Daily Fibonacci 38.2% | 104.98 |
| Daily Fibonacci 61.8% | 104.76 |
| Daily Pivot Point S1 | 104.66 |
| Daily Pivot Point S2 | 104.09 |
| Daily Pivot Point S3 | 103.76 |
| Daily Pivot Point R1 | 105.57 |
| Daily Pivot Point R2 | 105.90 |
| Daily Pivot Point R3 | 106.47 |
[/s2If]
Join Our Telegram Group
")


