Oil price has reached near four-day high around $77.00 amid escalating supply worries. (Pivot Orderbook analysis)
…
This is a premium post.
[s2If !current_user_can(access_s2member_level4)]Please register for PREMIUM VERSION HERE to read full post below containing analysis. In case of any error or you think you are not able to read the full post below, please email us at support#nehcap.com [lwa][/s2If] [s2If current_user_can(access_s2member_level4)]
- Oil price has reached near four-day high around $77.00 amid escalating supply worries.
- The 50-period EMA) at $76.65 is barricading the oil price.
- A range shift move by the RSI (14) indicates a bullish reversal.
The pair currently trades last at 76.72.
The previous day high was 76.66 while the previous day low was 74.15. The daily 38.2% Fib levels comes at 75.7, expected to provide support. Similarly, the daily 61.8% fib level is at 75.11, expected to provide support.
West Texas Intermediate (WTI), futures on NYMEX, have scaled to near four-day high around $77.00 after a healthy responsive buying from near $74.00. The oil price has ignored the rising hawkish Federal Reserve (Fed) bets after a revival in the United States’ household spending. The catalyst that is infusing strength in the oil price is the supply cut by Russia after sanctions from western allies to trim its funding for arms and ammunition for the invasion of Ukraine.
Volatility in the US Dollar Index (DXY) has squeezed dramatically, however, the upside is still favored as Fed policymakers are reiterating a hawkish stance to tame the stubborn inflation.
On a four-hour scale, the oil price has formed a Head and Shoulder chart pattern that conveys a sheer consolidation and results in a downside break after surrendering the neckline. The neckline of the aforementioned chart pattern is plotted from January 5 low at $72.64.
The 50-period Exponential Moving Average (EMA) at $76.65 is barricading the oil price, at the time of writing.
Meanwhile, the Relative Strength Index (RSI) (14) has delivered a range shift move from the bearish range of 20.00-40.00 to the 40.00-60.00 range, indicating a bullish reversal. The RSI (14) has taken support at 40.00.
A responsive buying in the oil price favors an upside to near February 3 high around $78.18 and round-level resistance of $80.00 after surpassing a four-day high around $77.00 decisively.
In an alternate scenario, a confident break below the H&S neckline will drag the asset towards December 9 low at $70.27 followed by September 2021 low around $67.00.
WTI four-hour chart
Technical Levels: Supports and Resistances
XTIUSD currently trading at 76.72 at the time of writing. Pair opened at 76.64 and is trading with a change of 0.1 % .
| Overview | Overview.1 | |
|---|---|---|
| 0 | Today last price | 76.72 |
| 1 | Today Daily Change | 0.08 |
| 2 | Today Daily Change % | 0.10 |
| 3 | Today daily open | 76.64 |
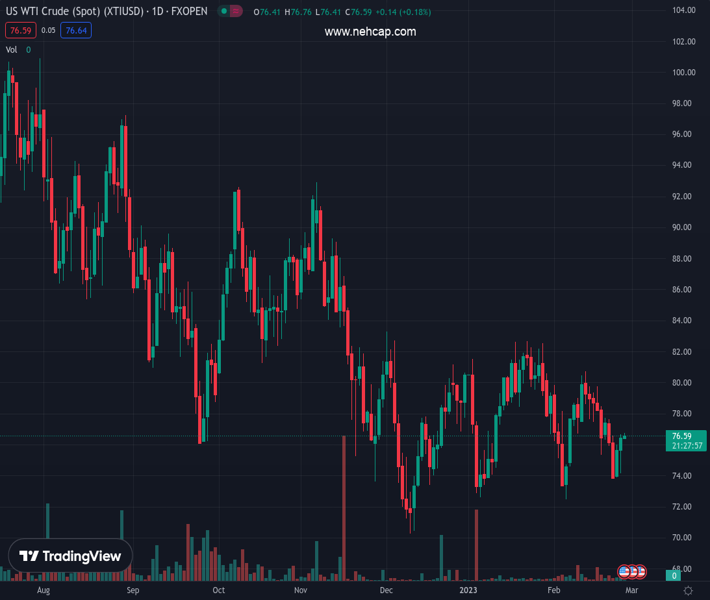
The pair remains strongly bearish on the daily time frame. It trades below the 20 SMA @ 77.22, 50 SMA 78.02, 100 SMA @ 80.25 and 200 SMA @ 88.6.
| Trends | Trends.1 | |
|---|---|---|
| 0 | Daily SMA20 | 77.22 |
| 1 | Daily SMA50 | 78.02 |
| 2 | Daily SMA100 | 80.25 |
| 3 | Daily SMA200 | 88.60 |
The previous day high was 76.66 while the previous day low was 74.15. The daily 38.2% Fib levels comes at 75.7, expected to provide support. Similarly, the daily 61.8% fib level is at 75.11, expected to provide support.
Note the levels of interest below:
- Pivot support is noted at 74.97, 73.31, 72.47
- Pivot resistance is noted at 77.48, 78.32, 79.98
| Levels | Levels.1 |
|---|---|
| Previous Daily High | 76.66 |
| Previous Daily Low | 74.15 |
| Previous Weekly High | 77.75 |
| Previous Weekly Low | 73.86 |
| Previous Monthly High | 82.68 |
| Previous Monthly Low | 72.64 |
| Daily Fibonacci 38.2% | 75.70 |
| Daily Fibonacci 61.8% | 75.11 |
| Daily Pivot Point S1 | 74.97 |
| Daily Pivot Point S2 | 73.31 |
| Daily Pivot Point S3 | 72.47 |
| Daily Pivot Point R1 | 77.48 |
| Daily Pivot Point R2 | 78.32 |
| Daily Pivot Point R3 | 79.98 |
[/s2If]
Join Our Telegram Group
")


