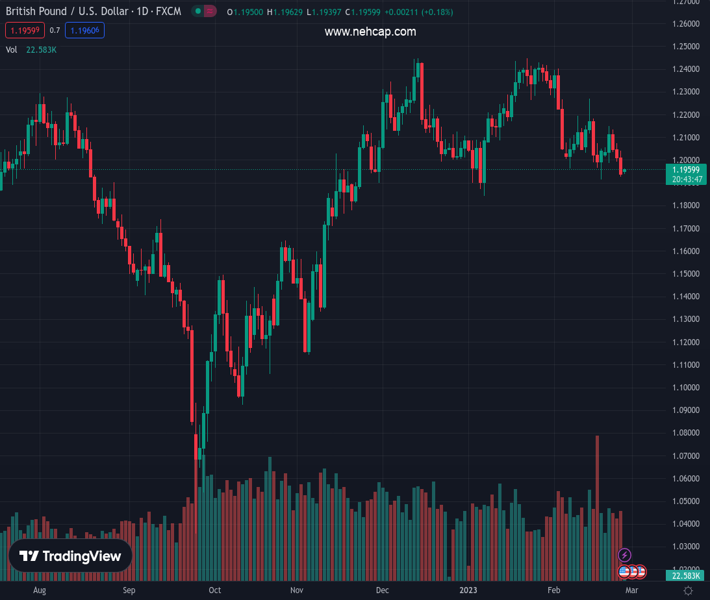
#GBPUSD @ 1.19583 prints mild intraday gains after two-week downtrend. (Pivot Orderbook analysis)
…
This is a premium post.
[s2If !current_user_can(access_s2member_level4)]Please register for PREMIUM VERSION HERE to read full post below containing analysis. In case of any error or you think you are not able to read the full post below, please email us at support#nehcap.com [lwa][/s2If] [s2If current_user_can(access_s2member_level4)]
- GBP/USD prints mild intraday gains after two-week downtrend.
- Optimism surrounding EU-UK Brexit deal on NI protocol lures buyers ahead of today’s official announcements.
- Fears of Conservatives’ walkout, workers’ strikes keep Cable bears hopeful.
- US data bolsters Fed bets and underpin US Dollar strength, geopolitical woes also strengthen the greenback.
The pair currently trades last at 1.19583.
The previous day high was 1.2042 while the previous day low was 1.1928. The daily 38.2% Fib levels comes at 1.1972, expected to provide resistance. Similarly, the daily 61.8% fib level is at 1.1999, expected to provide resistance.
GBP/USD picks up bids to refresh intraday high near 1.1955, printing mild intraday gains during Monday’s mid-Asian session after declining in the last two consecutive weeks. In doing so, the Cable pair cheers the upbeat headlines surrounding Brexit, as well as the US Dollar’s retreat amid an inactive session. However, the cautious mood ahead of today’s key announcements keeps the quote on the dicey floor.
During the weekend, Deputy Prime minister Dominic Raab told BBC’s Laura Kuenssberg that the UK ‘is on the cusp’ of securing a new Brexit deal on Northern Ireland. The policymaker also mentioned that the government had made ‘great progress’ negotiating with the European Union.
On the same line, The Times reports that UK Prime Minister Rishi Sunak may have obtained significant concessions in a looming Brexit deal.
It should be noted that an upbeat survey release from Boston Consulting Group Centre for Growth also allows the GBP/USD pair to remain firmer. “More than 60% of British businesses are optimistic about the country’s economic growth in the medium term and their revenues in the next few years,” the survey showed on Monday per Reuters.
Alternatively, the ongoing workers’ strikes in the UK join the fears of the Conservatives’ walkout from the compromised Brexit deal to challenge the latest optimism.
However, strong US inflation cues and hawkish Fed concerns challenge the GBP/USD buyers. That said, the US Dollar Index (DXY) marked the biggest weekly jump since September 2022 in the last as strong prints of the Fed’s preferred inflation gauge, namely the Core Personal Consumption Expenditures (PCE) Price Index marked an impressive run-up. The same line allowed the Fed policymakers to reiterate their hawkish bias and underpin the market’s bets for higher Federal Reserve (Fed) rates.
Other than the hawkish Fed concerns, geopolitical fears surrounding Russia and China also propel the DXY and probe the GBP/USD pair’s recovery moves.
Against this backdrop, S&P 500 Futures remain indecisive even as Wall Street benchmarks posted the biggest weekly fall in 2023. That said, the US two-year Treasury bond yields rose to the highest levels since early November 2022, staying mostly unchanged at the latest.
Looking forward, UK PM Sunak and European Commission President Ursula von der Leyen’s announcement of a new Brexit deal for Northern Ireland will be crucial for the GBP/USD traders to watch.
A daily closing below the seven-week-old ascending support line, around 1.1930 by the press time, becomes necessary for the GBP/USD bears to keep the reins.
Technical Levels: Supports and Resistances
GBPUSD currently trading at 1.1961 at the time of writing. Pair opened at 1.1943 and is trading with a change of 0.15% % .
| Overview | Overview.1 | |
|---|---|---|
| 0 | Today last price | 1.1961 |
| 1 | Today Daily Change | 0.0018 |
| 2 | Today Daily Change % | 0.15% |
| 3 | Today daily open | 1.1943 |
The pair is trading below its 20 Daily moving average @ 1.2109, below its 50 Daily moving average @ 1.2149 , above its 100 Daily moving average @ 1.1941 and above its 200 Daily moving average @ 1.193
| Trends | Trends.1 | |
|---|---|---|
| 0 | Daily SMA20 | 1.2109 |
| 1 | Daily SMA50 | 1.2149 |
| 2 | Daily SMA100 | 1.1941 |
| 3 | Daily SMA200 | 1.1930 |
The previous day high was 1.2042 while the previous day low was 1.1928. The daily 38.2% Fib levels comes at 1.1972, expected to provide resistance. Similarly, the daily 61.8% fib level is at 1.1999, expected to provide resistance.
Note the levels of interest below:
- Pivot support is noted at 1.19, 1.1858, 1.1787
- Pivot resistance is noted at 1.2014, 1.2085, 1.2127
| Levels | Levels.1 |
|---|---|
| Previous Daily High | 1.2042 |
| Previous Daily Low | 1.1928 |
| Previous Weekly High | 1.2148 |
| Previous Weekly Low | 1.1928 |
| Previous Monthly High | 1.2448 |
| Previous Monthly Low | 1.1841 |
| Daily Fibonacci 38.2% | 1.1972 |
| Daily Fibonacci 61.8% | 1.1999 |
| Daily Pivot Point S1 | 1.1900 |
| Daily Pivot Point S2 | 1.1858 |
| Daily Pivot Point S3 | 1.1787 |
| Daily Pivot Point R1 | 1.2014 |
| Daily Pivot Point R2 | 1.2085 |
| Daily Pivot Point R3 | 1.2127 |
[/s2If]
Join Our Telegram Group
")


