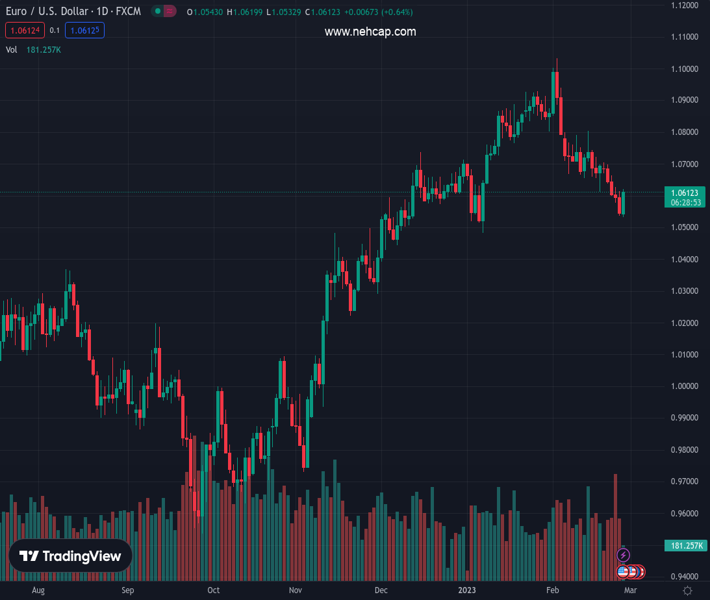
#EURUSD @ 1.06174 Euro rises for the first time in five days versus the US Dollar. (Pivot Orderbook analysis)
…
This is a premium post.
[s2If !current_user_can(access_s2member_level4)]Please register for PREMIUM VERSION HERE to read full post below containing analysis. In case of any error or you think you are not able to read the full post below, please email us at support#nehcap.com [lwa][/s2If] [s2If current_user_can(access_s2member_level4)]
- Euro rises for the first time in five days versus the US Dollar.
- Improvement in risk sentiment weighs on DXY.
- EUR/USD up more than 50 pips for the day.
The pair currently trades last at 1.06174.
The previous day high was 1.0614 while the previous day low was 1.0536. The daily 38.2% Fib levels comes at 1.0566, expected to provide support. Similarly, the daily 61.8% fib level is at 1.0585, expected to provide support.
The EUR/USD is having so far the best day since February 1 on Monday, boosted by a weaker US Dollar across the board on the back of an improvement in risk sentiment and a retreat in Treasury yields. The pair is trading near 1.0615 after hitting earlier at 1.0532, the lowest level in seven weeks.
Economic data released on Monday in the US showed a larger-than-expected decline in Durable Goods Orders. The headline dropped by 4.5%, against expectations of a 4% slide. Most details of the report were positive. “The drop in January durable goods was due entirely to a reversal in aircraft orders, and core capital goods orders rose by the most in five months. The durables data thus add to a string of strong economic data for January and suggest while manufacturing activity may be set to weaken further, it’s not collapsing”, said analysts at Wells Fargo.
A different report showed Pending Home Sales surged 8.1% in January, surprising market participants that expected an increase of around 1%. Compared to a year ago, sales were down 24.1%.
The US dollar weakened after the economic figures while at the same time, equity prices in Wall Street rose further. The S&P 500 is up by 1.13% and the Nasdaq gains 1.42%. Stocks are recovering after the worst week in two months.
US yields are modestly lower for the day. Treasury bonds recovered ground early in the American session. The US 2-year bond yield peaked at 4.85% (highest since November) and is back below 4.80% as of writing. The retreat in US yields is helping EUR/USD move further north as the DXY drops by more than 0.55%.
The pair printed a fresh daily high at 1.0610 and is having the best performance in weeks. The euro is breaking a four-day negative streak.
The euro is testing levels above 1.0600 and is starting to look at the next relevant resistance area at 1.0630, as it holds a bullish intraday bias. A slide back under 1.0585, would change the intraday bias to negative again.
Technical Levels: Supports and Resistances
EURUSD currently trading at 1.0584 at the time of writing. Pair opened at 1.0547 and is trading with a change of 0.35 % .
| Overview | Overview.1 | |
|---|---|---|
| 0 | Today last price | 1.0584 |
| 1 | Today Daily Change | 0.0037 |
| 2 | Today Daily Change % | 0.3500 |
| 3 | Today daily open | 1.0547 |
The pair is trading below its 20 Daily moving average @ 1.073, below its 50 Daily moving average @ 1.0726 , above its 100 Daily moving average @ 1.0451 and above its 200 Daily moving average @ 1.0331
| Trends | Trends.1 | |
|---|---|---|
| 0 | Daily SMA20 | 1.0730 |
| 1 | Daily SMA50 | 1.0726 |
| 2 | Daily SMA100 | 1.0451 |
| 3 | Daily SMA200 | 1.0331 |
The previous day high was 1.0614 while the previous day low was 1.0536. The daily 38.2% Fib levels comes at 1.0566, expected to provide support. Similarly, the daily 61.8% fib level is at 1.0585, expected to provide support.
Note the levels of interest below:
- Pivot support is noted at 1.0517, 1.0488, 1.0439
- Pivot resistance is noted at 1.0596, 1.0644, 1.0674
| Levels | Levels.1 |
|---|---|
| Previous Daily High | 1.0614 |
| Previous Daily Low | 1.0536 |
| Previous Weekly High | 1.0705 |
| Previous Weekly Low | 1.0536 |
| Previous Monthly High | 1.0930 |
| Previous Monthly Low | 1.0483 |
| Daily Fibonacci 38.2% | 1.0566 |
| Daily Fibonacci 61.8% | 1.0585 |
| Daily Pivot Point S1 | 1.0517 |
| Daily Pivot Point S2 | 1.0488 |
| Daily Pivot Point S3 | 1.0439 |
| Daily Pivot Point R1 | 1.0596 |
| Daily Pivot Point R2 | 1.0644 |
| Daily Pivot Point R3 | 1.0674 |
[/s2If]
Join Our Telegram Group
")


