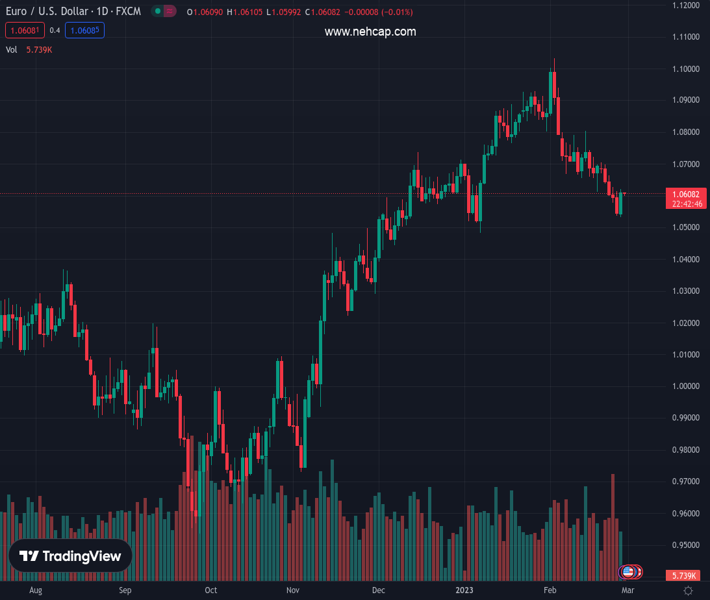
#EURUSD @ 1.06087 fades bounce off seven-week low ahead of second-tier US data. (Pivot Orderbook analysis)
…
This is a premium post.
[s2If !current_user_can(access_s2member_level4)]Please register for PREMIUM VERSION HERE to read full post below containing analysis. In case of any error or you think you are not able to read the full post below, please email us at support#nehcap.com [lwa][/s2If] [s2If current_user_can(access_s2member_level4)]
- EUR/USD fades bounce off seven-week low ahead of second-tier US data.
- Mixed US statistics, month-end positioning allowed Euro bears to take a breather.
- Firmer sentiment, pullback in yields offered additional support to the recovery moves.
- Cautious mood, hawkish Fedspeak challenge recovery moves.
The pair currently trades last at 1.06087.
The previous day high was 1.0614 while the previous day low was 1.0536. The daily 38.2% Fib levels comes at 1.0566, expected to provide support. Similarly, the daily 61.8% fib level is at 1.0585, expected to provide support.
EUR/USD seesaws around 1.0600 during early Tuesday, after bouncing off a seven-week low to post the biggest daily gains in more than three weeks. In doing so, the major currency pair seeks fresh direction to extend the week-start rebound amid mixed catalysts and a light calendar.
On Monday, the US Dollar Index (DXY) snapped a four-day uptrend while reversing from the highest levels in nearly two months on mixed data, as well as a lack of major negatives for the sentiment. In doing so, the greenback’s gauge paid little heed to the ongoing Russia-Ukraine tensions and hawkish Federal Reserve (Fed) concerns, while tracing the Treasury bond yields.
That said, US Durable Goods Orders slumped -4.5% in January versus -4.0% expected and 5.1% prior. However, the Nondefense Capital Goods Orders ex Aircraft grew 0.8% versus 0.0% analysts’ expectations and -0.3% previous readings. On the same line, the US Pending Home Sales rallied 8.0% MoM versus 1.0% expected and 1.1% prior.
At home, data published by the European Commission revealed that the Economic Sentiment Indicator in the Euro area edged lower to 99.7 in February from 99.8 in January, compared to analysts’ estimate of 101.
The US data triggered the much-needed pullback in the US Treasury bond yields as the benchmark 10-year coupon dropped three basis points (bps) to 3.92% after a five-week uptrend while the two-year counterpart followed the suit by retreating from a three-month high to 4.78%.
It’s worth noting that US National Security Advisor Jake Sullivan said on CNN’s “State of the Union,” China’s stance on the Russian invasion of Ukraine puts it in an “awkward” position internationally and any weapons support to Russia would come with “real costs.”
Elsewhere, Federal Reserve Governor Philip Jefferson said on Monday that it is important to get back to 2% inflation to allow those sorts of sustained economic gains. Reuters also portrayed hawkish Fed concerns while saying, “Economic data this month reflected still tight jobs markets and inflation remaining sticky, leading Fed funds futures traders to bet on higher rates, which in the US are now seen peaking in September at 5.4%, up from 4.58% now.”
Amid these plays, Wall Street closed on the positive side but failed to post major gains amid month-end moves.
It should be observed that the latest headlines suggesting the easing stance of the US towards China seem to have helped the S&P 500 Futures to track Wall Street benchmarks.
Moving on, US Conference Board’s Consumer Confidence, Chicago Purchasing Managers’ Index and Richmond Fed Manufacturing Index for February, as well as the preliminary US trade numbers for January, will be important for immediate directions.
A clear rebound from the 200-day Exponential Moving Average (EMA), around 1.0530, followed by a successful break of the two-week-old descending trend line, now immediate support near 1.0585, keeps EUR/USD buyers hopeful.
Technical Levels: Supports and Resistances
EURUSD currently trading at 1.0607 at the time of writing. Pair opened at 1.0547 and is trading with a change of 0.57% % .
| Overview | Overview.1 | |
|---|---|---|
| 0 | Today last price | 1.0607 |
| 1 | Today Daily Change | 0.0060 |
| 2 | Today Daily Change % | 0.57% |
| 3 | Today daily open | 1.0547 |
The pair is trading below its 20 Daily moving average @ 1.073, below its 50 Daily moving average @ 1.0726 , above its 100 Daily moving average @ 1.0451 and above its 200 Daily moving average @ 1.0331
| Trends | Trends.1 | |
|---|---|---|
| 0 | Daily SMA20 | 1.0730 |
| 1 | Daily SMA50 | 1.0726 |
| 2 | Daily SMA100 | 1.0451 |
| 3 | Daily SMA200 | 1.0331 |
The previous day high was 1.0614 while the previous day low was 1.0536. The daily 38.2% Fib levels comes at 1.0566, expected to provide support. Similarly, the daily 61.8% fib level is at 1.0585, expected to provide support.
Note the levels of interest below:
- Pivot support is noted at 1.0517, 1.0488, 1.0439
- Pivot resistance is noted at 1.0596, 1.0644, 1.0674
| Levels | Levels.1 |
|---|---|
| Previous Daily High | 1.0614 |
| Previous Daily Low | 1.0536 |
| Previous Weekly High | 1.0705 |
| Previous Weekly Low | 1.0536 |
| Previous Monthly High | 1.0930 |
| Previous Monthly Low | 1.0483 |
| Daily Fibonacci 38.2% | 1.0566 |
| Daily Fibonacci 61.8% | 1.0585 |
| Daily Pivot Point S1 | 1.0517 |
| Daily Pivot Point S2 | 1.0488 |
| Daily Pivot Point S3 | 1.0439 |
| Daily Pivot Point R1 | 1.0596 |
| Daily Pivot Point R2 | 1.0644 |
| Daily Pivot Point R3 | 1.0674 |
[/s2If]
Join Our Telegram Group
")


