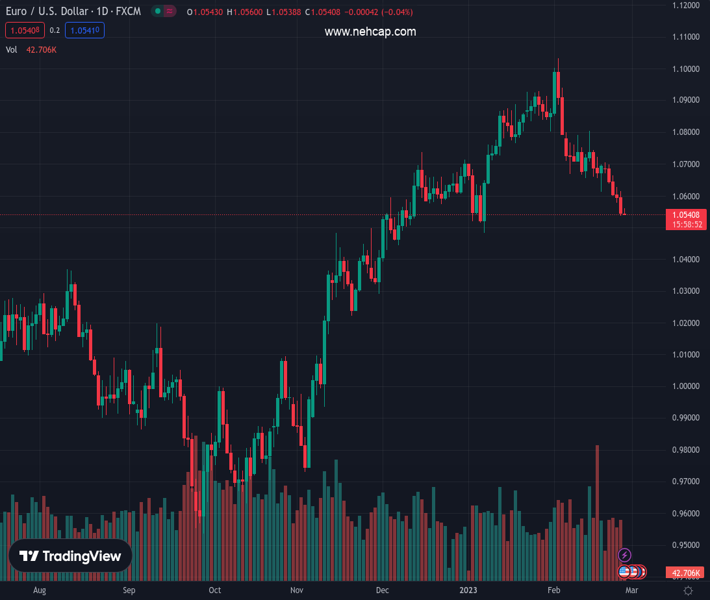
#EURUSD @ 1.05406 remains depressed near the seven-week low as bears poke intraday bottom. (Pivot Orderbook analysis)
…
This is a premium post.
[s2If !current_user_can(access_s2member_level4)]Please register for PREMIUM VERSION HERE to read full post below containing analysis. In case of any error or you think you are not able to read the full post below, please email us at support#nehcap.com [lwa][/s2If] [s2If current_user_can(access_s2member_level4)]
- EUR/USD remains depressed near the seven-week low as bears poke intraday bottom.
- Upbeat US Treasury bond yields, hawkish Fed bets contrast with hopes of higher ECB rates to challenge Euro pair sellers.
- US data, UN Human Rights Council session eyed for intraday directions.
The pair currently trades last at 1.05406.
The previous day high was 1.0614 while the previous day low was 1.0536. The daily 38.2% Fib levels comes at 1.0566, expected to provide resistance. Similarly, the daily 61.8% fib level is at 1.0585, expected to provide resistance.
EUR/USD bears poke the 1.0540-30 support confluence surrounding the seven-week low amid the lackluster markets heading into Monday’s European session. In doing so, the major currency pair struggles to justify hawkish European Central Bank (ECB) concerns ahead of the key US data and geopolitical events.
That said, the US Dollar Index (DXY) grinds near intraday high of around 105.30 following the initial pullback from a seven-week high. The US Dollar’s recent run-up could be linked to the strong US Treasury bond yields, as well as hawkish Fed speak and fears of more geopolitical tension surrounding Ukraine.
It’s worth noting that upbeat US inflation linked data from the US joined the Fed policymakers’ support for higher rates to propel the Fed fund futures to above 5.30%, versus 5.10% expected by the US central bank in December. The same joins the latest bout of sanctions on Russia from the West to escalate the market’s fears of more geopolitical burden on the bloc, which in turn increases the odds of recession in the Old continent even if the policymakers have been against the same of late.
It’s worth observing that ECB President Christine Lagarde advocated the need for higher rates during the weekend while speaking to the Helsingin Sanomat. On the same line, ECB policymaker and Bundesbank Chief Joachim Nagel said on Friday, he “can’t rule significant further rate hikes after March.”
Amid these plays, the US 10-year Treasury yields reverse the early-day losses to around 3.95%. Further, the two-year counterparts jump back towards the highest levels since November 2022, marked the previous day, as bond bears poke the 4.83% level by the press time. Further, the S&P 500 Futures lick its wounds with mild gains after the Wall Street benchmark posted the biggest weekly slump of 2023.
Moving ahead, the start of the United Nations (UN) Human Rights Council session in Geneva becomes crucial for the EUR/USD pair watchers ahead of the US Durable Goods Orders for January, expected -4.0% versus 5.6% prior. Considering the downbeat expectations from the US data, the pair sellers may witness further hardships in breaking the 1.0540-30 key support.
An 11-week-old ascending support line joins the 200-bar Exponential Moving Average (EMA) to highlight the 1.0540-30 as the key support for the EUR/USD bears to watch during the quote’s further downside. That said, oversold RSI conditions add strength to the stated support zone.
Technical Levels: Supports and Resistances
EURUSD currently trading at 1.0542 at the time of writing. Pair opened at 1.0547 and is trading with a change of -0.05% % .
| Overview | Overview.1 | |
|---|---|---|
| 0 | Today last price | 1.0542 |
| 1 | Today Daily Change | -0.0005 |
| 2 | Today Daily Change % | -0.05% |
| 3 | Today daily open | 1.0547 |
The pair is trading below its 20 Daily moving average @ 1.073, below its 50 Daily moving average @ 1.0726 , above its 100 Daily moving average @ 1.0451 and above its 200 Daily moving average @ 1.0331
| Trends | Trends.1 | |
|---|---|---|
| 0 | Daily SMA20 | 1.0730 |
| 1 | Daily SMA50 | 1.0726 |
| 2 | Daily SMA100 | 1.0451 |
| 3 | Daily SMA200 | 1.0331 |
The previous day high was 1.0614 while the previous day low was 1.0536. The daily 38.2% Fib levels comes at 1.0566, expected to provide resistance. Similarly, the daily 61.8% fib level is at 1.0585, expected to provide resistance.
Note the levels of interest below:
- Pivot support is noted at 1.0517, 1.0488, 1.0439
- Pivot resistance is noted at 1.0596, 1.0644, 1.0674
| Levels | Levels.1 |
|---|---|
| Previous Daily High | 1.0614 |
| Previous Daily Low | 1.0536 |
| Previous Weekly High | 1.0705 |
| Previous Weekly Low | 1.0536 |
| Previous Monthly High | 1.0930 |
| Previous Monthly Low | 1.0483 |
| Daily Fibonacci 38.2% | 1.0566 |
| Daily Fibonacci 61.8% | 1.0585 |
| Daily Pivot Point S1 | 1.0517 |
| Daily Pivot Point S2 | 1.0488 |
| Daily Pivot Point S3 | 1.0439 |
| Daily Pivot Point R1 | 1.0596 |
| Daily Pivot Point R2 | 1.0644 |
| Daily Pivot Point R3 | 1.0674 |
[/s2If]
Join Our Telegram Group
")


