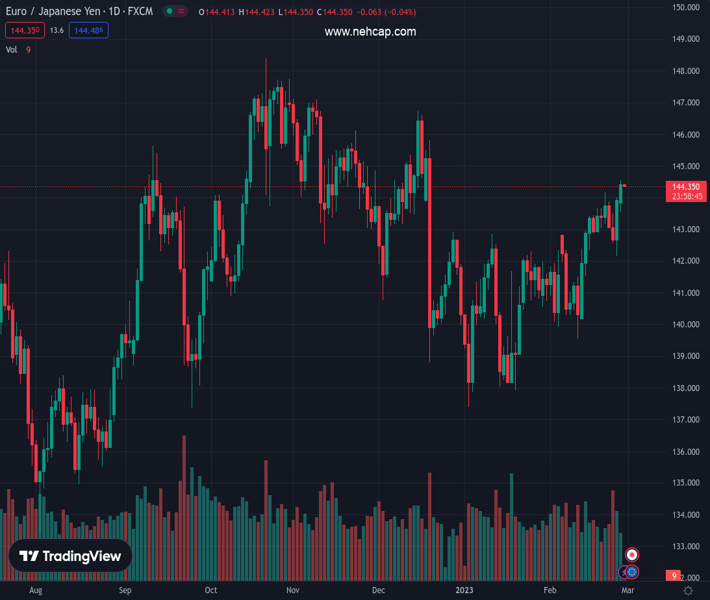
#EURJPY @ 144.533 is trading at new year-to-date highs above 144.50. (Pivot Orderbook analysis)
…
This is a premium post.
[s2If !current_user_can(access_s2member_level4)]Please register for PREMIUM VERSION HERE to read full post below containing analysis. In case of any error or you think you are not able to read the full post below, please email us at support#nehcap.com [lwa][/s2If] [s2If current_user_can(access_s2member_level4)]
- EUR/JPY is trading at new year-to-date highs above 144.50.
- EUR/JPY Price Analysis: It’s upward biased; in the near term, it might test 145.00.
The pair currently trades last at 144.533.
The previous day high was 144.01 while the previous day low was 142.16. The daily 38.2% Fib levels comes at 143.3, expected to provide support. Similarly, the daily 61.8% fib level is at 142.86, expected to provide support.
The EUR/JPY rallies to fresh 2023 highs around 144.54 and is set to extend its gains, past solid resistance around the November 30 daily high of 144.85. At the time of writing, the EUR/JPY is trading at 144.49, above its opening price by 0.49%.
The daily candlestick chart portrays the EUR/JPY as upward biased. As of typing, the cross is piercing a four-month-old downslope resistance trendline, which, if broken, would keep bulls hopeful of driving prices higher. The Relative Strength Index (RSI) supports a bullish continuation, while the Rate of Change (RoC) witnessed a jump in volatility that favors the bulls.
Given the backdrop, the EUR/JPY’s first resistance would be the 145.00 psychological level. A breach of the latter will expose the December 20 daily high at 145.83, closely followed by the 146.00 figure, followed by the December 15 high at 146.72.
As an alternate scenario, the EUR/JPY’s first demand zone would be the February 21 high of 144.16, which, once cleared and the EUR/JPY would easily be dragged to the 144.00 mark. If sellers surpassed that area, the 20-day Exponential Moving Average (EMA) at 142.60 would be in play, but first sellers need to clear 143.00.
Technical Levels: Supports and Resistances
EURJPY currently trading at 144.52 at the time of writing. Pair opened at 143.88 and is trading with a change of 0.44 % .
| Overview | Overview.1 | |
|---|---|---|
| 0 | Today last price | 144.52 |
| 1 | Today Daily Change | 0.64 |
| 2 | Today Daily Change % | 0.44 |
| 3 | Today daily open | 143.88 |
The pair remains strongly bullish on the daily timeframe. It trades above its 20 SMA @ 142.16, 50 SMA 141.34, 100 SMA @ 143.12 and 200 SMA @ 141.46.
| Trends | Trends.1 | |
|---|---|---|
| 0 | Daily SMA20 | 142.16 |
| 1 | Daily SMA50 | 141.34 |
| 2 | Daily SMA100 | 143.12 |
| 3 | Daily SMA200 | 141.46 |
The previous day high was 144.01 while the previous day low was 142.16. The daily 38.2% Fib levels comes at 143.3, expected to provide support. Similarly, the daily 61.8% fib level is at 142.86, expected to provide support.
Note the levels of interest below:
- Pivot support is noted at 142.69, 141.49, 140.83
- Pivot resistance is noted at 144.54, 145.2, 146.4
| Levels | Levels.1 |
|---|---|
| Previous Daily High | 144.01 |
| Previous Daily Low | 142.16 |
| Previous Weekly High | 144.16 |
| Previous Weekly Low | 142.16 |
| Previous Monthly High | 142.86 |
| Previous Monthly Low | 137.39 |
| Daily Fibonacci 38.2% | 143.30 |
| Daily Fibonacci 61.8% | 142.86 |
| Daily Pivot Point S1 | 142.69 |
| Daily Pivot Point S2 | 141.49 |
| Daily Pivot Point S3 | 140.83 |
| Daily Pivot Point R1 | 144.54 |
| Daily Pivot Point R2 | 145.20 |
| Daily Pivot Point R3 | 146.40 |
[/s2If]
Join Our Telegram Group
")


