DXY loses some upside impetus and retreats to the sub-105.00 area. (Pivot Orderbook analysis)
…
This is a premium post.
[s2If !current_user_can(access_s2member_level4)]Please register for PREMIUM VERSION HERE to read full post below containing analysis. In case of any error or you think you are not able to read the full post below, please email us at support#nehcap.com [lwa][/s2If] [s2If current_user_can(access_s2member_level4)]
- DXY loses some upside impetus and retreats to the sub-105.00 area.
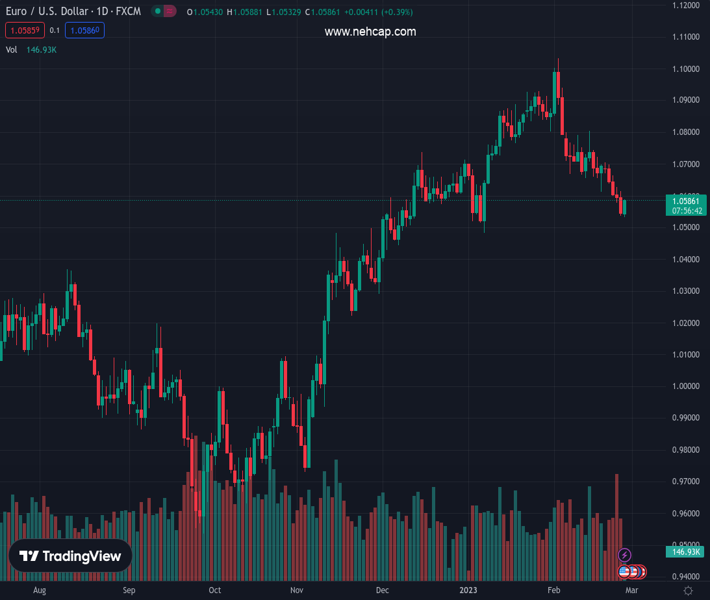
- Bulls continue to target the 2023 high around 105.60 in the short term.
The pair currently trades last at 104.93.
The previous day high was 105.32 while the previous day low was 104.42. The daily 38.2% Fib levels comes at 104.98, expected to provide resistance. Similarly, the daily 61.8% fib level is at 104.76, expected to provide support.
DXY comes under pressure following fresh tops near 105.40 on Monday.
The ongoing price action favours the continuation of the uptrend in spite of the ongoing corrective move. Further bouts of strength should then clear the February high at 105.35 (February 27) to allow for a probable challenge of the 2023 top at 105.63 (January 6).
In the longer run, while below the 200-day SMA at 106.48, the outlook for the index remains negative.
Technical Levels: Supports and Resistances
EURUSD currently trading at 104.93 at the time of writing. Pair opened at 105.24 and is trading with a change of -0.29 % .
| Overview | Overview.1 | |
|---|---|---|
| 0 | Today last price | 104.93 |
| 1 | Today Daily Change | 49.00 |
| 2 | Today Daily Change % | -0.29 |
| 3 | Today daily open | 105.24 |
The pair is trading above its 20 Daily moving average @ 103.41, above its 50 Daily moving average @ 103.33 , below its 100 Daily moving average @ 105.24 and below its 200 Daily moving average @ 106.82
| Trends | Trends.1 | |
|---|---|---|
| 0 | Daily SMA20 | 103.41 |
| 1 | Daily SMA50 | 103.33 |
| 2 | Daily SMA100 | 105.24 |
| 3 | Daily SMA200 | 106.82 |
The previous day high was 105.32 while the previous day low was 104.42. The daily 38.2% Fib levels comes at 104.98, expected to provide resistance. Similarly, the daily 61.8% fib level is at 104.76, expected to provide support.
Note the levels of interest below:
- Pivot support is noted at 104.66, 104.09, 103.76
- Pivot resistance is noted at 105.57, 105.9, 106.47
| Levels | Levels.1 |
|---|---|
| Previous Daily High | 105.32 |
| Previous Daily Low | 104.42 |
| Previous Weekly High | 105.32 |
| Previous Weekly Low | 103.76 |
| Previous Monthly High | 105.63 |
| Previous Monthly Low | 101.50 |
| Daily Fibonacci 38.2% | 104.98 |
| Daily Fibonacci 61.8% | 104.76 |
| Daily Pivot Point S1 | 104.66 |
| Daily Pivot Point S2 | 104.09 |
| Daily Pivot Point S3 | 103.76 |
| Daily Pivot Point R1 | 105.57 |
| Daily Pivot Point R2 | 105.90 |
| Daily Pivot Point R3 | 106.47 |
[/s2If]
Join Our Telegram Group
")


