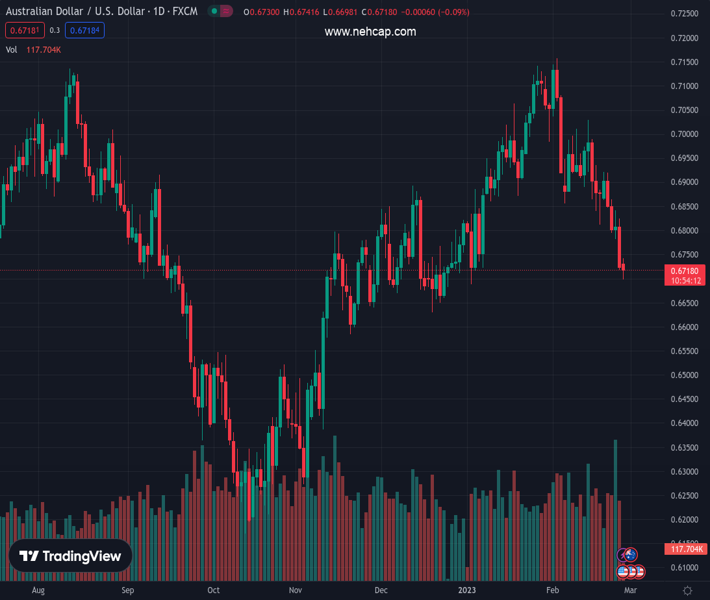
#AUDUSD @ 0.67188 drops to a fresh low since January, though shows some resilience below the 0.6700 mark. (Pivot Orderbook analysis)
…
This is a premium post.
[s2If !current_user_can(access_s2member_level4)]Please register for PREMIUM VERSION HERE to read full post below containing analysis. In case of any error or you think you are not able to read the full post below, please email us at support#nehcap.com [lwa][/s2If] [s2If current_user_can(access_s2member_level4)]
- AUD/USD drops to a fresh low since January, though shows some resilience below the 0.6700 mark.
- A positive risk tone prompts some USD profit-taking and lends support to the risk-sensitive Aussie.
- Bets for more rate hikes by the Fed, elevated US bond yields limit the USD slide and cap the major.
The pair currently trades last at 0.67188.
The previous day high was 0.6824 while the previous day low was 0.6719. The daily 38.2% Fib levels comes at 0.6759, expected to provide resistance. Similarly, the daily 61.8% fib level is at 0.6784, expected to provide resistance.
The AUD/USD pair kicks off the new week on a weaker note and drops to a fresh low since January 6, though manages to recovery a few pips from sub-0.6700 levels. The pair is currently placed around the 0.6715-0.6720 region, down over 0.10% for the day, and remains at the mercy of the US Dollar price dynamics.
A goodish recovery in the US equity futures prompts some profit-taking around the safe-haven Greenback and seems to benefit the risk-sensitive Aussie. That said, the prospects for further policy tightening by the Federal Reserve keep the US Treasury bond yields elevated, which, in turn, helps limit losses for the USD and continues to weigh on the AUD/USD pair.
The markets now seem convinced that the US central bank will stick to its hawkish stance for longer and the bets were reaffirmed by the stronger US PCE Price Index data released on Friday. Furthermore, the recent upbeat US macro data point to an economy that remains resilient despite rising borrowing costs and should allow the Fed to continue hiking rates.
Investors, meanwhile, remain worried about economic headwinds stemming from a hawkish stance adopted by major central banks. Apart from this, geopolitical tensions should keep a lid on any optimistic move in the markets, at least for now, and favour the USD bulls. This, in turn, suggests that the path of least resistance for the AUD/USD pair is to the downside.
Market participants now look forward to the US economic docket, featuring the release of Durable Goods Orders and Pending Home Sales data. This, along with the US bond yields, will influence the USD price dynamics and provide some impetus to the AUD/USD pair. Traders will further take cues from the broader risk sentiment to grab short-term opportunities around the major.
Technical Levels: Supports and Resistances
AUDUSD currently trading at 0.6714 at the time of writing. Pair opened at 0.6727 and is trading with a change of -0.19 % .
| Overview | Overview.1 | |
|---|---|---|
| 0 | Today last price | 0.6714 |
| 1 | Today Daily Change | -0.0013 |
| 2 | Today Daily Change % | -0.1900 |
| 3 | Today daily open | 0.6727 |
The pair remains strongly bearish on the daily time frame. It trades below the 20 SMA @ 0.693, 50 SMA 0.6893, 100 SMA @ 0.6726 and 200 SMA @ 0.6801.
| Trends | Trends.1 | |
|---|---|---|
| 0 | Daily SMA20 | 0.6930 |
| 1 | Daily SMA50 | 0.6893 |
| 2 | Daily SMA100 | 0.6726 |
| 3 | Daily SMA200 | 0.6801 |
The previous day high was 0.6824 while the previous day low was 0.6719. The daily 38.2% Fib levels comes at 0.6759, expected to provide resistance. Similarly, the daily 61.8% fib level is at 0.6784, expected to provide resistance.
Note the levels of interest below:
- Pivot support is noted at 0.6689, 0.6651, 0.6584
- Pivot resistance is noted at 0.6795, 0.6862, 0.69
| Levels | Levels.1 |
|---|---|
| Previous Daily High | 0.6824 |
| Previous Daily Low | 0.6719 |
| Previous Weekly High | 0.6921 |
| Previous Weekly Low | 0.6719 |
| Previous Monthly High | 0.7143 |
| Previous Monthly Low | 0.6688 |
| Daily Fibonacci 38.2% | 0.6759 |
| Daily Fibonacci 61.8% | 0.6784 |
| Daily Pivot Point S1 | 0.6689 |
| Daily Pivot Point S2 | 0.6651 |
| Daily Pivot Point S3 | 0.6584 |
| Daily Pivot Point R1 | 0.6795 |
| Daily Pivot Point R2 | 0.6862 |
| Daily Pivot Point R3 | 0.6900 |
[/s2If]
Join Our Telegram Group
")


