#USDCAD @ 1.36090 seesaws around seven-week high as bulls await more clues. (Pivot Orderbook analysis)
…
This is a premium post.
[s2If !current_user_can(access_s2member_level4)]Please register for PREMIUM VERSION HERE to read full post below containing analysis. In case of any error or you think you are not able to read the full post below, please email us at support#nehcap.com [lwa][/s2If] [s2If current_user_can(access_s2member_level4)]
- USD/CAD seesaws around seven-week high as bulls await more clues.
- Broad US Dollar strength supersede Oil price recovery as bulls keep the reins in the last two consecutive weeks.
- Strong US data underpin hawkish Fed bets and propel Loonie pair buyers.
- US ISM PMIs, Canada Q4 GDP eyed for clear directions.
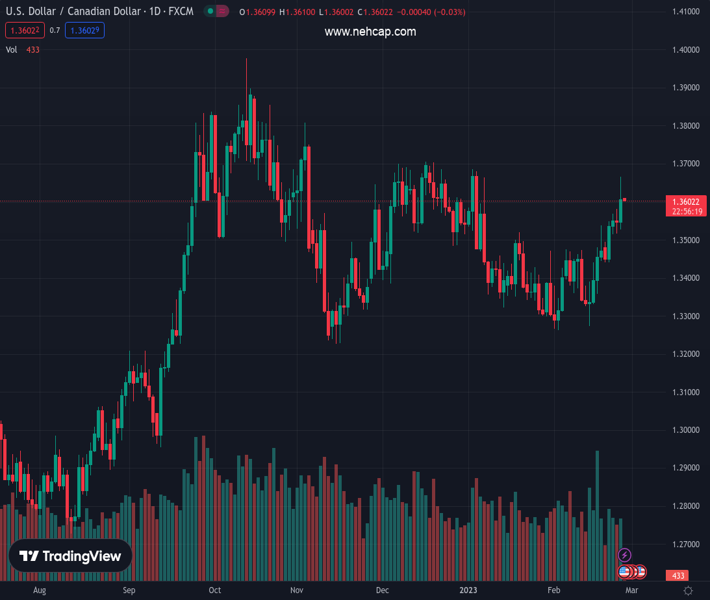
The pair currently trades last at 1.36090.
The previous day high was 1.3666 while the previous day low was 1.3527. The daily 38.2% Fib levels comes at 1.3613, expected to provide resistance. Similarly, the daily 61.8% fib level is at 1.358, expected to provide support.
USD/CAD buyers flirt with the 1.3600 threshold during Monday’s sluggish Asian session, following a two-week uptrend to the highest levels since early January. The Loonie pair’s latest gains seem to take more clues from the upbeat US Dollar than prices of Canada’s key export, namely the WTI crude oil. However, the cautious mood ahead of the key Canadian data appear probing the pair buyers of late.
That said, the US Dollar Index (DXY) marked a four-week uptrend by the end of Friday, grinding near the highest levels in seven weeks of late, on strong United States data, especially relating to inflation, underpinned hawkish Federal Reserve concerns.
On Friday, the Personal Consumption Expenditures (PCE) Price Index rose to 5.4% YoY versus 5.3% prior and 4.9% market forecasts. Further, the more relevant Core PCE Price Index, known as Fed’s favorite inflation gauge, rose to 4.7% YoY, compared 4.6% prior and analysts’ forecast of 4.3%.
While tracing upbeat US data, the Federal Reserve (Fed) officials were also hawkish and backed the US Dollar bulls, as well as USD/CAD pair buyers.
Cleveland Fed President Loretta Mester told CNBC on Friday that his funds’ rate was above the median in December and still thinks they need to be somewhat above 5%. The policymaker also added that inflation risks still tilted to the upside. On the same line, Federal Reserve Bank of Boston President Susan Collins said, “More rate hikes needed to deal with ‘too high’ inflation.” Furthermore, Governor Philip Jefferson said, “Wage growth in the US is running too high to be consistent with a timely and sustainable return to the Federal Reserve’s 2% inflation objective.”
Also highlighting the US inflation woes was US Treasury Secretary Janet Yellen who spoke on the sideline of the Group of 20 (G20) meetings on Friday. “Inflation is coming down if you measure it on a 12-month basis, but still core inflation, which I think will fall further, remains higher than is consistent with 2%,” said the diplomat.
On the other hand, WTI crude oil seesaw around $76.50 after bouncing off a three-week low in the last two consecutive days.
A daily closing beyond a downward-sloping trend line from November 2022, now immediate support around 1.3560, directs the USD/CAD bulls towards the last December’s peak surrounding 1.3700.
Technical Levels: Supports and Resistances
USDCAD currently trading at 1.3606 at the time of writing. Pair opened at 1.3606 and is trading with a change of 0.0 % .
| Overview | Overview.1 | |
|---|---|---|
| 0 | Today last price | 1.3606 |
| 1 | Today Daily Change | 0.0000 |
| 2 | Today Daily Change % | 0.0000 |
| 3 | Today daily open | 1.3606 |
The pair remains strongly bullish on the daily timeframe. It trades above its 20 SMA @ 1.3424, 50 SMA 1.3462, 100 SMA @ 1.3512 and 200 SMA @ 1.3264.
| Trends | Trends.1 | |
|---|---|---|
| 0 | Daily SMA20 | 1.3424 |
| 1 | Daily SMA50 | 1.3462 |
| 2 | Daily SMA100 | 1.3512 |
| 3 | Daily SMA200 | 1.3264 |
The previous day high was 1.3666 while the previous day low was 1.3527. The daily 38.2% Fib levels comes at 1.3613, expected to provide resistance. Similarly, the daily 61.8% fib level is at 1.358, expected to provide support.
Note the levels of interest below:
- Pivot support is noted at 1.3534, 1.3462, 1.3396
- Pivot resistance is noted at 1.3672, 1.3738, 1.381
| Levels | Levels.1 |
|---|---|
| Previous Daily High | 1.3666 |
| Previous Daily Low | 1.3527 |
| Previous Weekly High | 1.3666 |
| Previous Weekly Low | 1.3441 |
| Previous Monthly High | 1.3685 |
| Previous Monthly Low | 1.3300 |
| Daily Fibonacci 38.2% | 1.3613 |
| Daily Fibonacci 61.8% | 1.3580 |
| Daily Pivot Point S1 | 1.3534 |
| Daily Pivot Point S2 | 1.3462 |
| Daily Pivot Point S3 | 1.3396 |
| Daily Pivot Point R1 | 1.3672 |
| Daily Pivot Point R2 | 1.3738 |
| Daily Pivot Point R3 | 1.3810 |
[/s2If]
Join Our Telegram Group
")


