#NZDUSD @ 0.61600 sent to the backfoot on hawkish US data. (Pivot Orderbook analysis)
…
This is a premium post.
[s2If !current_user_can(access_s2member_level4)]Please register for PREMIUM VERSION HERE to read full post below containing analysis. In case of any error or you think you are not able to read the full post below, please email us at support#nehcap.com [lwa][/s2If] [s2If current_user_can(access_s2member_level4)]
- NZD/USD sent to the backfoot on hawkish US data.
- US Dollar firms on US PCE and rate hike outlook.
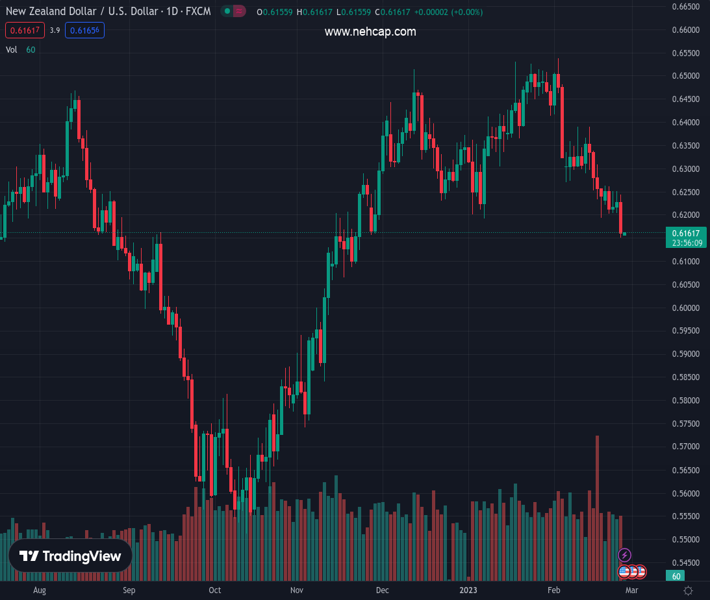
The pair currently trades last at 0.61600.
The previous day high was 0.6252 while the previous day low was 0.6151. The daily 38.2% Fib levels comes at 0.619, expected to provide resistance. Similarly, the daily 61.8% fib level is at 0.6214, expected to provide resistance.
NZD/USD was pressured at the end of last week due to a late surge in the USD as demand for the currency took off, sending the DXY index through 105 in the wake of a stronger-than-expected US core PCE deflator.
This was the Fed’s preferred measure of inflation, and the data companies a slew of prior inflationary data outcomes from the US calendar over the past few weeks.
The data’s reacceleration has sent shockwaves through US markets, which analysts at ANZ Bank explained ”which are now pricing in a 5.4% peak in the fed funds rate and are in the process of pricing out cuts in H2 2023.”
The analysts said that they’ve discussed this potential for some time, and it is now materialising. ”But while it speaks to a stronger-than-otherwise USD, unlike in 2022, the Fed isn’t outpacing all other central banks, and locally, risks are now tilted towards the RBNZ also having more work to do,” the analysts argued. ”That may in time make the NZD more resilient to USD strength than other currencies, but that wasn’t evident overnight.”
Meanwhile, New Zealand Retail Sales for the fourth quarter came in at -0.6% vs the prior 0.4%. For the year, it arrived at -4%.
Technical Levels: Supports and Resistances
NZDUSD currently trading at 0.6166 at the time of writing. Pair opened at 0.6165 and is trading with a change of 0.02 % .
| Overview | Overview.1 | |
|---|---|---|
| 0 | Today last price | 0.6166 |
| 1 | Today Daily Change | 0.0001 |
| 2 | Today Daily Change % | 0.0200 |
| 3 | Today daily open | 0.6165 |
The pair remains strongly bearish on the daily time frame. It trades below the 20 SMA @ 0.6318, 50 SMA 0.6348, 100 SMA @ 0.6186 and 200 SMA @ 0.6184.
| Trends | Trends.1 | |
|---|---|---|
| 0 | Daily SMA20 | 0.6318 |
| 1 | Daily SMA50 | 0.6348 |
| 2 | Daily SMA100 | 0.6186 |
| 3 | Daily SMA200 | 0.6184 |
The previous day high was 0.6252 while the previous day low was 0.6151. The daily 38.2% Fib levels comes at 0.619, expected to provide resistance. Similarly, the daily 61.8% fib level is at 0.6214, expected to provide resistance.
Note the levels of interest below:
- Pivot support is noted at 0.6127, 0.6089, 0.6026
- Pivot resistance is noted at 0.6227, 0.629, 0.6328
| Levels | Levels.1 |
|---|---|
| Previous Daily High | 0.6252 |
| Previous Daily Low | 0.6151 |
| Previous Weekly High | 0.6263 |
| Previous Weekly Low | 0.6151 |
| Previous Monthly High | 0.6531 |
| Previous Monthly Low | 0.6190 |
| Daily Fibonacci 38.2% | 0.6190 |
| Daily Fibonacci 61.8% | 0.6214 |
| Daily Pivot Point S1 | 0.6127 |
| Daily Pivot Point S2 | 0.6089 |
| Daily Pivot Point S3 | 0.6026 |
| Daily Pivot Point R1 | 0.6227 |
| Daily Pivot Point R2 | 0.6290 |
| Daily Pivot Point R3 | 0.6328 |
[/s2If]
Join Our Telegram Group
")


