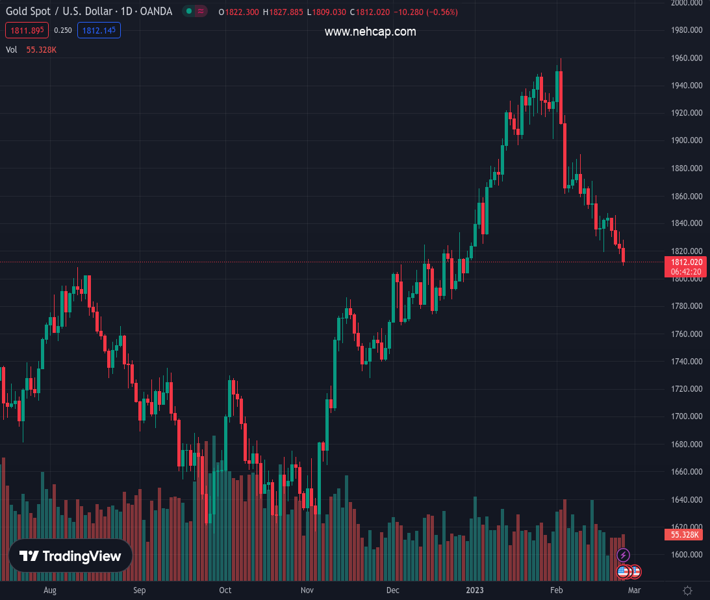
#XAUUSD @ 1,812.08 US Dollar and yields rise further after US economic data. (Pivot Orderbook analysis)
…
This is a premium post.
[s2If !current_user_can(access_s2member_level4)]Please register for PREMIUM VERSION HERE to read full post below containing analysis. In case of any error or you think you are not able to read the full post below, please email us at support#nehcap.com [lwa][/s2If] [s2If current_user_can(access_s2member_level4)]
- US Dollar and yields rise further after US economic data.
- US Core PCE rises above expectations in January.
- Gold hits fresh weekly lows near $1,810.
The pair currently trades last at 1812.08.
The previous day high was 1833.88 while the previous day low was 1817.44. The daily 38.2% Fib levels comes at 1823.72, expected to provide resistance. Similarly, the daily 61.8% fib level is at 1827.6, expected to provide resistance.
Gold prices dropped further after the beginning of the American session amid a stronger US Dollar and higher Treasury bond yields following data that showed the core PCE rose at the highest rate in six months, above expectations.
XAU/USD bottomed at $1,809/oz, the lowest level since December 29. It is hovering around the lows, looking at the $1,800 area. The 20-week Simple Moving Average awaits at $1,797. Bulls need to recover the $1,820 area in order to alleviate the bearish pressure.
The downside extended following the January Personal Income and Spending. The numbers came in above expectations. Market participants looked into inflation numbers. The Federal Reserve’s preferred inflation gauge, the core PCE rose by 0.6%, to an annual rate of 4.7%, up from the 4.6% of December and against expectations of a decline.
The Dollar gained momentum after the economic numbers, US yields soarrf and equity prices tumbled. The context added pressure to gold that is fighting to hold above $1,810. The 2-year Treasury yield is at 4.79%, the highest since November and the 10-year is at 3.93%.
Technical Levels: Supports and Resistances
XAUUSD currently trading at 1811.38 at the time of writing. Pair opened at 1823.48 and is trading with a change of -0.66 % .
| Overview | Overview.1 | |
|---|---|---|
| 0 | Today last price | 1811.38 |
| 1 | Today Daily Change | -12.10 |
| 2 | Today Daily Change % | -0.66 |
| 3 | Today daily open | 1823.48 |
The pair is trading below its 20 Daily moving average @ 1869.94, below its 50 Daily moving average @ 1864.98 , above its 100 Daily moving average @ 1791.19 and above its 200 Daily moving average @ 1776.19
| Trends | Trends.1 | |
|---|---|---|
| 0 | Daily SMA20 | 1869.94 |
| 1 | Daily SMA50 | 1864.98 |
| 2 | Daily SMA100 | 1791.19 |
| 3 | Daily SMA200 | 1776.19 |
The previous day high was 1833.88 while the previous day low was 1817.44. The daily 38.2% Fib levels comes at 1823.72, expected to provide resistance. Similarly, the daily 61.8% fib level is at 1827.6, expected to provide resistance.
Note the levels of interest below:
- Pivot support is noted at 1815.99, 1808.49, 1799.55
- Pivot resistance is noted at 1832.43, 1841.37, 1848.87
| Levels | Levels.1 |
|---|---|
| Previous Daily High | 1833.88 |
| Previous Daily Low | 1817.44 |
| Previous Weekly High | 1870.71 |
| Previous Weekly Low | 1818.93 |
| Previous Monthly High | 1949.27 |
| Previous Monthly Low | 1823.76 |
| Daily Fibonacci 38.2% | 1823.72 |
| Daily Fibonacci 61.8% | 1827.60 |
| Daily Pivot Point S1 | 1815.99 |
| Daily Pivot Point S2 | 1808.49 |
| Daily Pivot Point S3 | 1799.55 |
| Daily Pivot Point R1 | 1832.43 |
| Daily Pivot Point R2 | 1841.37 |
| Daily Pivot Point R3 | 1848.87 |
[/s2If]
Join Our Telegram Group
")


