#NZDUSD @ 0.62309 struggles to extend two-day recovery moves, sidelined of late., @nehcap view: Further downside expected (Pivot Orderbook analysis)
…
This is a premium post.
[s2If !current_user_can(access_s2member_level4)]Please register for PREMIUM VERSION HERE to read full post below containing analysis. In case of any error or you think you are not able to read the full post below, please email us at support#nehcap.com [lwa][/s2If] [s2If current_user_can(access_s2member_level4)]
- NZD/USD struggles to extend two-day recovery moves, sidelined of late.
- Three-week-old descending resistance line guards immediate upside ahead of 200-day EMA.
- Horizontal area from early January appears strong support to watch amid bearish MACD signals, nearly oversold RSI conditions.
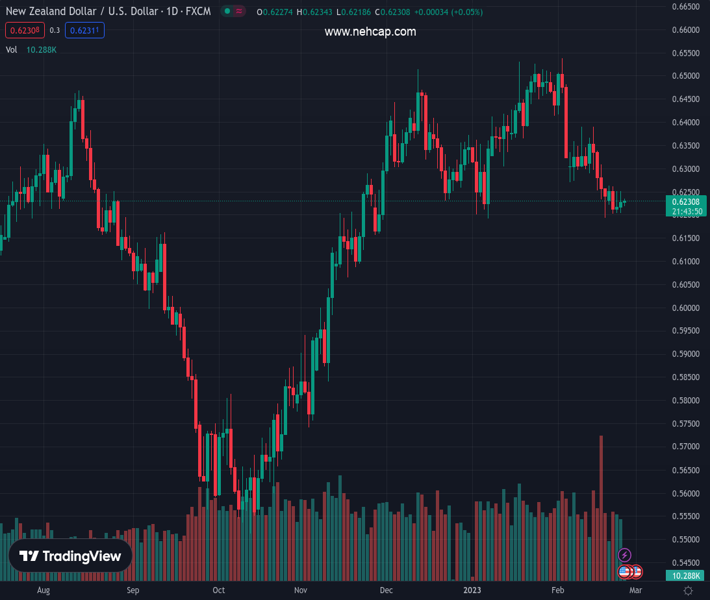
The pair currently trades last at 0.62309.
The previous day high was 0.6252 while the previous day low was 0.6202. The daily 38.2% Fib levels comes at 0.6233, expected to provide resistance. Similarly, the daily 61.8% fib level is at 0.6221, expected to provide support.
NZD/USD remains defensive near 0.6230, struggling to extend the two-day winning streak during Friday’s Asian session. In doing so, the Kiwi pair grinds with an important trading range amid mixed oscillators.
That said, the quote currently jostles with a downward-sloping resistance line from February 02, close to 0.6250 by the press time, as the RSI (14) line seesaws around the oversold territory while the MACD signals are bearish.
The same suggests that the bearish bias remains intact with the downside room appearing limited.
As a result, a seven-week-old horizontal support area surrounding 0.6190 appears the key for the NZD/USD bears to watch during the quote’s further downside.
It’s worth noting that the Kiwi pair’s downside below 0.6190 could aim for 0.6100 while any further downside will need validation from the mid-November swing low surrounding 0.6060 before poking the 0.6000 threshold.
On the flip side, a daily closing beyond the aforementioned three-week-old resistance line will need to cross the 200-day Exponential Moving Average (EMA) level surrounding 0.6275 to convince the NZD/USD buyers. In that case, a run-up toward the February 14 high near 0.6390 can’t be ruled out.
Overall, NZD/USD is likely to remain bearish but the downside needs validation from 0.6190.
Trend: Further downside expected
Technical Levels: Supports and Resistances
NZDUSD currently trading at 0.623 at the time of writing. Pair opened at 0.6233 and is trading with a change of -0.05% % .
| Overview | Overview.1 | |
|---|---|---|
| 0 | Today last price | 0.623 |
| 1 | Today Daily Change | -0.0003 |
| 2 | Today Daily Change % | -0.05% |
| 3 | Today daily open | 0.6233 |
The pair is trading below its 20 Daily moving average @ 0.6334, below its 50 Daily moving average @ 0.6352 , above its 100 Daily moving average @ 0.6181 and above its 200 Daily moving average @ 0.6185
| Trends | Trends.1 | |
|---|---|---|
| 0 | Daily SMA20 | 0.6334 |
| 1 | Daily SMA50 | 0.6352 |
| 2 | Daily SMA100 | 0.6181 |
| 3 | Daily SMA200 | 0.6185 |
The previous day high was 0.6252 while the previous day low was 0.6202. The daily 38.2% Fib levels comes at 0.6233, expected to provide resistance. Similarly, the daily 61.8% fib level is at 0.6221, expected to provide support.
Note the levels of interest below:
- Pivot support is noted at 0.6206, 0.6179, 0.6156
- Pivot resistance is noted at 0.6256, 0.6279, 0.6306
| Levels | Levels.1 |
|---|---|
| Previous Daily High | 0.6252 |
| Previous Daily Low | 0.6202 |
| Previous Weekly High | 0.6391 |
| Previous Weekly Low | 0.6193 |
| Previous Monthly High | 0.6531 |
| Previous Monthly Low | 0.6190 |
| Daily Fibonacci 38.2% | 0.6233 |
| Daily Fibonacci 61.8% | 0.6221 |
| Daily Pivot Point S1 | 0.6206 |
| Daily Pivot Point S2 | 0.6179 |
| Daily Pivot Point S3 | 0.6156 |
| Daily Pivot Point R1 | 0.6256 |
| Daily Pivot Point R2 | 0.6279 |
| Daily Pivot Point R3 | 0.6306 |
[/s2If]
Join Our Telegram Group
")


