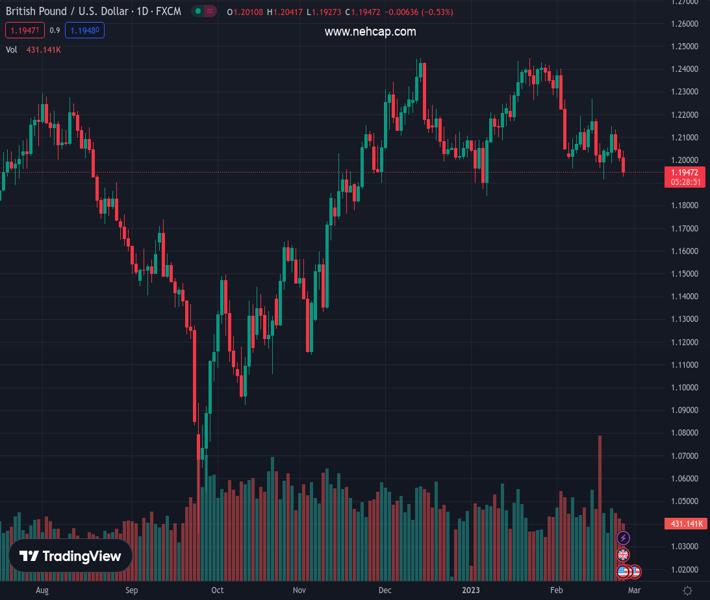
#GBPUSD @ 1.19485 US Dollar extends gains during Friday’s American session. (Pivot Orderbook analysis)
…
This is a premium post.
[s2If !current_user_can(access_s2member_level4)]Please register for PREMIUM VERSION HERE to read full post below containing analysis. In case of any error or you think you are not able to read the full post below, please email us at support#nehcap.com [lwa][/s2If] [s2If current_user_can(access_s2member_level4)]
- US Dollar extends gains during Friday’s American session.
- Economic data continues to support more rate hikes from the Fed.
- GBP/USD tests levels under critical support area of 1.1940.
The pair currently trades last at 1.19485.
The previous day high was 1.2075 while the previous day low was 1.1992. The daily 38.2% Fib levels comes at 1.2024, expected to provide resistance. Similarly, the daily 61.8% fib level is at 1.2043, expected to provide resistance.
The GBP/USD dropped further on Friday following the release of US economic data and bottomed at 1.1927, the lowest level in a week, and slightly above the monthly low.
The pound is consolidating weekly losses amid a stronger US Dollar and higher US yields. US activity and inflation figures above consensus favoured expectations of higher for longer interest rates. As a consequence, the 2-year Treasury yield jumped to the highest since November at 4.79% and the 10-year moved toward 4%.
The dollar on Friday accelerated to the upside also boosted by a deterioration in market sentiment. The GBP/USD broke decisively below 1.2000. It is hovering around 1.1940/50, down almost a hundred pips for the level it had a week ago.
The weekly chart shows the price testing the 20-week moving average, after being unable to recover above the 20-day moving average at 1.2120. It is falling for the third consecutive day.
“Should the pair yield a daily closing below the critical support around the 1.1940 level, where the 100 and 200 DMAs (Daily Moving Averages) converge, a sharp sell-off toward the 1.1900 round figure will be in the offing. Further south, the 2023 low of 1.1841 will be next on sellers’ radars”, writes Dhawni Mehta, Analyst at FXStreet. According to Mehta, the GBP/USD needs acceptance above the 1.2150 static resistance and the 50-day DMA to initiate a fresh recovery toward 1.2200.
Technical Levels: Supports and Resistances
GBPUSD currently trading at 1.1952 at the time of writing. Pair opened at 1.2023 and is trading with a change of -0.59 % .
| Overview | Overview.1 | |
|---|---|---|
| 0 | Today last price | 1.1952 |
| 1 | Today Daily Change | -0.0071 |
| 2 | Today Daily Change % | -0.5900 |
| 3 | Today daily open | 1.2023 |
The pair is trading below its 20 Daily moving average @ 1.2131, below its 50 Daily moving average @ 1.2153 , above its 100 Daily moving average @ 1.1932 and above its 200 Daily moving average @ 1.1933
| Trends | Trends.1 | |
|---|---|---|
| 0 | Daily SMA20 | 1.2131 |
| 1 | Daily SMA50 | 1.2153 |
| 2 | Daily SMA100 | 1.1932 |
| 3 | Daily SMA200 | 1.1933 |
The previous day high was 1.2075 while the previous day low was 1.1992. The daily 38.2% Fib levels comes at 1.2024, expected to provide resistance. Similarly, the daily 61.8% fib level is at 1.2043, expected to provide resistance.
Note the levels of interest below:
- Pivot support is noted at 1.1985, 1.1948, 1.1903
- Pivot resistance is noted at 1.2068, 1.2113, 1.2151
| Levels | Levels.1 |
|---|---|
| Previous Daily High | 1.2075 |
| Previous Daily Low | 1.1992 |
| Previous Weekly High | 1.2270 |
| Previous Weekly Low | 1.1915 |
| Previous Monthly High | 1.2448 |
| Previous Monthly Low | 1.1841 |
| Daily Fibonacci 38.2% | 1.2024 |
| Daily Fibonacci 61.8% | 1.2043 |
| Daily Pivot Point S1 | 1.1985 |
| Daily Pivot Point S2 | 1.1948 |
| Daily Pivot Point S3 | 1.1903 |
| Daily Pivot Point R1 | 1.2068 |
| Daily Pivot Point R2 | 1.2113 |
| Daily Pivot Point R3 | 1.2151 |
[/s2If]
Join Our Telegram Group
")


