#XAGUSD @ 21.315 Silver price holds lower ground near one-week bottom, down for the third consecutive day., @nehcap view: Limited downside expected (Pivot Orderbook analysis)
…
This is a premium post.
[s2If !current_user_can(access_s2member_level4)]Please register for PREMIUM VERSION HERE to read full post below containing analysis. In case of any error or you think you are not able to read the full post below, please email us at support#nehcap.com [lwa][/s2If] [s2If current_user_can(access_s2member_level4)]
- Silver price holds lower ground near one-week bottom, down for the third consecutive day.
- Three-month-old ascending trend line, 200-DMA to join nearly oversold RSI to challenge XAG/USD bears.
- Buyers remain off the table unless crossing 100-DMA.
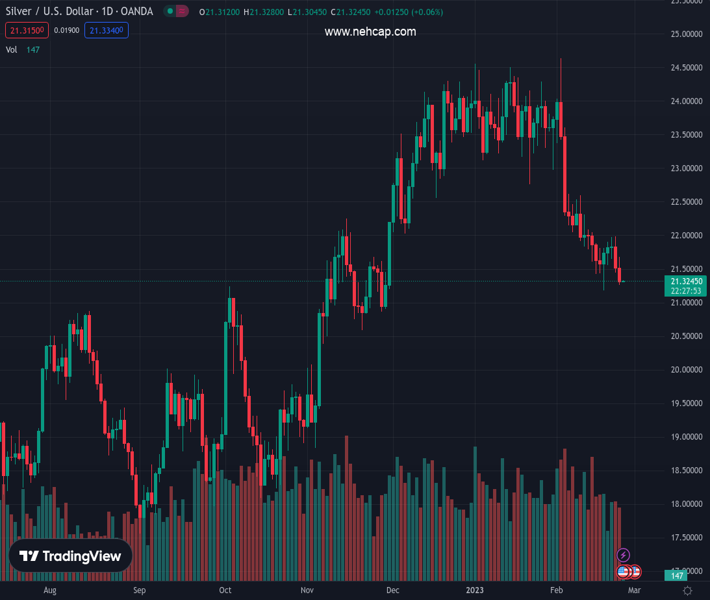
The pair currently trades last at 21.315.
The previous day high was 21.98 while the previous day low was 21.44. The daily 38.2% Fib levels comes at 21.65, expected to provide resistance. Similarly, the daily 61.8% fib level is at 21.78, expected to provide resistance.
Silver price (XAG/USD) remains on the back foot at the weekly low near $21.30 during early Friday in Asia. In doing so, the bright metal drops for the third consecutive day while extending the early-week pullback from the 100-DMA and a 3.5-month-old horizontal resistance area.
It’s worth noting that the bearish MACD signals keep the XAG/USD sellers hopeful. However, the RSI (14) appears oversold and suggests a pause in the metal’s south run.
As a result, an upward-sloping support line from late November, close to $21.20 by the press time, as well as the 200-DMA level of around $21.00, gain major attention.
Following that, the late November swing low of around $20.60-55 could act as the last defense of the Silver buyers before directing the commodity price towards November 2022 bottom near $18.80.
Meanwhile, recovery moves may initially aim for the $21.50 before jostling with the aforementioned horizontal resistance area and the 100-DMA surrounding $22.00-05.
In a case where the Silver price offers a daily closing beyond $22.05, February 09 high near $22.60 and the previous monthly low near $22.80 will be crucial to watch for the XAG/USD bulls.
Trend: Limited downside expected
Technical Levels: Supports and Resistances
XAGUSD currently trading at 21.3 at the time of writing. Pair opened at 21.5 and is trading with a change of -0.93% % .
| Overview | Overview.1 | |
|---|---|---|
| 0 | Today last price | 21.3 |
| 1 | Today Daily Change | -0.20 |
| 2 | Today Daily Change % | -0.93% |
| 3 | Today daily open | 21.5 |
The pair is trading below its 20 Daily moving average @ 22.47, below its 50 Daily moving average @ 23.22 , below its 100 Daily moving average @ 22.01 and above its 200 Daily moving average @ 21.02
| Trends | Trends.1 | |
|---|---|---|
| 0 | Daily SMA20 | 22.47 |
| 1 | Daily SMA50 | 23.22 |
| 2 | Daily SMA100 | 22.01 |
| 3 | Daily SMA200 | 21.02 |
The previous day high was 21.98 while the previous day low was 21.44. The daily 38.2% Fib levels comes at 21.65, expected to provide resistance. Similarly, the daily 61.8% fib level is at 21.78, expected to provide resistance.
Note the levels of interest below:
- Pivot support is noted at 21.3, 21.1, 20.76
- Pivot resistance is noted at 21.84, 22.18, 22.38
| Levels | Levels.1 |
|---|---|
| Previous Daily High | 21.98 |
| Previous Daily Low | 21.44 |
| Previous Weekly High | 22.08 |
| Previous Weekly Low | 21.18 |
| Previous Monthly High | 24.55 |
| Previous Monthly Low | 22.76 |
| Daily Fibonacci 38.2% | 21.65 |
| Daily Fibonacci 61.8% | 21.78 |
| Daily Pivot Point S1 | 21.30 |
| Daily Pivot Point S2 | 21.10 |
| Daily Pivot Point S3 | 20.76 |
| Daily Pivot Point R1 | 21.84 |
| Daily Pivot Point R2 | 22.18 |
| Daily Pivot Point R3 | 22.38 |
[/s2If]
Join Our Telegram Group
")


