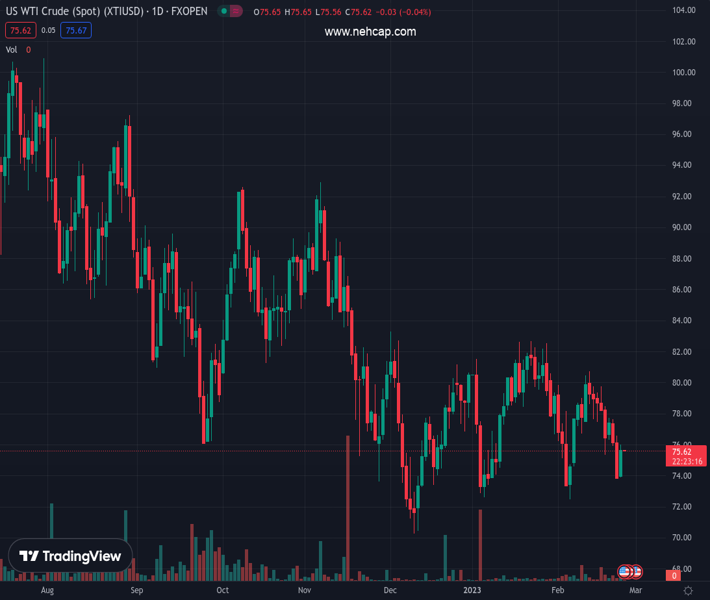
WTI has extended its recovery above $75.50 as Russia sets to deepen supply cuts. (Pivot Orderbook analysis)
…
This is a premium post.
[s2If !current_user_can(access_s2member_level4)]Please register for PREMIUM VERSION HERE to read full post below containing analysis. In case of any error or you think you are not able to read the full post below, please email us at support#nehcap.com [lwa][/s2If] [s2If current_user_can(access_s2member_level4)]
- WTI has extended its recovery above $75.50 as Russia sets to deepen supply cuts.
- Investors have started ignoring the impact of the huge oil inventory build-up reported by the US EIA.
- Chinese government’s commitment to revive and expand consumption is also providing support to the oil price.
The pair currently trades last at 75.7.
The previous day high was 76.58 while the previous day low was 73.86. The daily 38.2% Fib levels comes at 74.9, expected to provide support. Similarly, the daily 61.8% fib level is at 75.54, expected to provide support.
West Texas Intermediate (WTI), futures on NYMEX, have stretched their recovery above $75.50 in the early Tokyo session. Earlier, the oil price displayed a sheer sell-off after the United States American Petroleum Institute (API) announced a huge build-up of oil inventories for the week ending February 17.
Now, the higher build-up of oil stockpiles has been confirmed by the US Energy Information Administration (EIA) at 7.6 million barrels.
However, the oil price has ignored the oil building and has started rising as Russia is expected to deepen oil supply cuts in retaliation to sanctions from Western allies. To restrict funding for arms and ammunition in the battle against Ukraine, Western allies are continuously tightening the price cap on oil provided by Moscow in the international market. This has forced the Kremlin to deepen supply cuts, which might take off the oil price due to a supply glitch.
Russia is considering an oil supply cut at its western ports by up to 25% from March that exceeds its former 500,000 barrels oil supply cut announcement.
Apart from that, an assurance of a demand recovery from China’s commerce ministry has infused fresh blood into the oil bulls. A Chinese commerce ministry spokesperson said at a news conference on Thursday, the recovery momentum in the country’s consumer market was strong in January. He further added, “The government will take more measures to revive and expand consumption.”
Meanwhile, the rising appeal for the US Dollar could spoil the oil bulls’ party. The US Dollar Index (DXY) has shifted its business comfortably above 104.00 as the Federal Reserve (Fed) is dedicated to bringing United States inflation to normalcy by reaching the terminal rate in no time. The expectations of a continuation of policy tightening are supporting the USD Index.
Technical Levels: Supports and Resistances
XTIUSD currently trading at 75.7 at the time of writing. Pair opened at 73.94 and is trading with a change of 2.38 % .
| Overview | Overview.1 | |
|---|---|---|
| 0 | Today last price | 75.70 |
| 1 | Today Daily Change | 1.76 |
| 2 | Today Daily Change % | 2.38 |
| 3 | Today daily open | 73.94 |
The pair remains strongly bearish on the daily time frame. It trades below the 20 SMA @ 77.65, 50 SMA 77.99, 100 SMA @ 80.54 and 200 SMA @ 88.93.
| Trends | Trends.1 | |
|---|---|---|
| 0 | Daily SMA20 | 77.65 |
| 1 | Daily SMA50 | 77.99 |
| 2 | Daily SMA100 | 80.54 |
| 3 | Daily SMA200 | 88.93 |
The previous day high was 76.58 while the previous day low was 73.86. The daily 38.2% Fib levels comes at 74.9, expected to provide support. Similarly, the daily 61.8% fib level is at 75.54, expected to provide support.
Note the levels of interest below:
- Pivot support is noted at 73.0, 72.07, 70.28
- Pivot resistance is noted at 75.72, 77.51, 78.45
| Levels | Levels.1 |
|---|---|
| Previous Daily High | 76.58 |
| Previous Daily Low | 73.86 |
| Previous Weekly High | 80.75 |
| Previous Weekly Low | 75.34 |
| Previous Monthly High | 82.68 |
| Previous Monthly Low | 72.64 |
| Daily Fibonacci 38.2% | 74.90 |
| Daily Fibonacci 61.8% | 75.54 |
| Daily Pivot Point S1 | 73.00 |
| Daily Pivot Point S2 | 72.07 |
| Daily Pivot Point S3 | 70.28 |
| Daily Pivot Point R1 | 75.72 |
| Daily Pivot Point R2 | 77.51 |
| Daily Pivot Point R3 | 78.45 |
[/s2If]
Join Our Telegram Group
")


