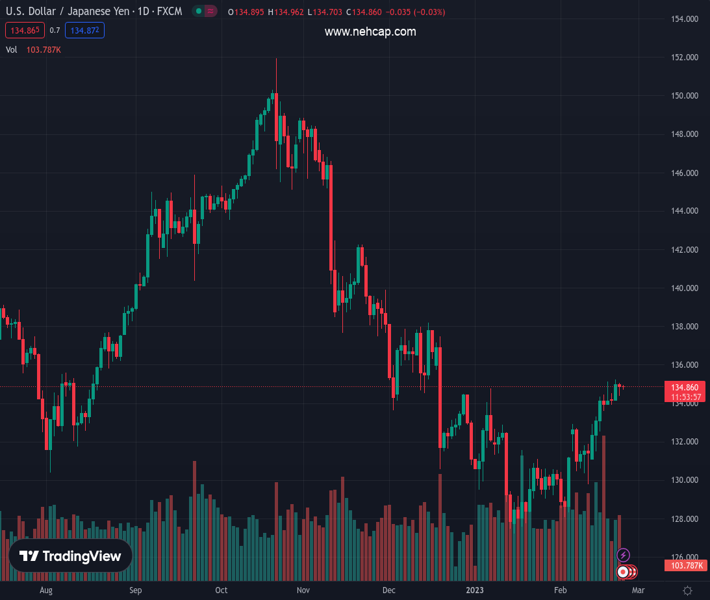
#USDJPY @ 134.847 is seen oscillating in a narrow trading band and remains below the YTD top. (Pivot Orderbook analysis)
…
This is a premium post.
[s2If !current_user_can(access_s2member_level4)]Please register for PREMIUM VERSION HERE to read full post below containing analysis. In case of any error or you think you are not able to read the full post below, please email us at support#nehcap.com [lwa][/s2If] [s2If current_user_can(access_s2member_level4)]
- USD/JPY is seen oscillating in a narrow trading band and remains below the YTD top.
- Bets for additional interest rate hikes by the Fed underpin the USD and lend support.
- Traders seem reluctant ahead of BoJ Governor candidate Ueda’s testimony on Friday.
The pair currently trades last at 134.847.
The previous day high was 135.06 while the previous day low was 134.37. The daily 38.2% Fib levels comes at 134.8, expected to provide support. Similarly, the daily 61.8% fib level is at 134.63, expected to provide support.
The USD/JPY pair struggles to gain any meaningful traction on Thursday and oscillates in a narrow band, just below the 135.00 psychological mark through the first half of the European session. Spot prices, meanwhile, remain well within the striking distance of the YTD peak, around the 135.20-135.25 region set earlier this week.
The US Dollar is seen consolidating its recent gains to a multi-week high, which, in turn, acts as a headwind for the USD/JPY pair. The downside, however, remains cushioned, at least for the time being, amid expectations that the Federal Reserve will continue raising interest rates to tame stubbornly high inflation. In fact, the FOMC minutes released on Wednesday showed that a few members favoured raising the target range for the federal funds rate by 50 bps or they could have supported it.
Adding to this, St. Louis Fed President James Bullard noted the need to get inflation on a sustainable path toward the target this year. This comes after the US CPI and PPI data indicated last week that inflation isn’t coming down quite as fast as hoped. Moreover, the US data pointed to an economy that remains resilient despite rising borrowing costs, which should allow the Fed to stick to its hawkish stance. This remains supportive of elevated US Treasury bond yields and lends some support to the Greenback.
Furthermore, a modest recovery in the global risk sentiment, which tends to undermine the safe-haven Japanese Yen (JPY), supports prospects for a further appreciating move for the USD/JPY pair. That said, traders seem reluctant to place aggressive bets and prefer to wait for the Bank of Japan (BoJ) Governor candidate Kazuo Ueda’s testimony on Friday. Ueda’s view on the future of yield curve control (YCC) and super-easy monetary policy should drive the JPY and provide a fresh impetus to the pair.
In the meantime, traders on Thursday will take cues from the US economic docket, featuring the release of the Prelim (second estimate) Q4 GDP print and the usual Weekly Initial Jobless Claims. This, along with the US bond yields, will drive the USD demand. Apart from this, the broader risk sentiment should contribute to producing short-term trading opportunities around the USD/JPY pair. Nevertheless, the fundamental backdrop suggests that the path of least resistance for the major is to the upside.
Technical Levels: Supports and Resistances
USDJPY currently trading at 134.82 at the time of writing. Pair opened at 134.94 and is trading with a change of -0.09 % .
| Overview | Overview.1 | |
|---|---|---|
| 0 | Today last price | 134.82 |
| 1 | Today Daily Change | -0.12 |
| 2 | Today Daily Change % | -0.09 |
| 3 | Today daily open | 134.94 |
The pair is trading above its 20 Daily moving average @ 131.96, above its 50 Daily moving average @ 131.86 , below its 100 Daily moving average @ 137.36 and below its 200 Daily moving average @ 137.01
| Trends | Trends.1 | |
|---|---|---|
| 0 | Daily SMA20 | 131.96 |
| 1 | Daily SMA50 | 131.86 |
| 2 | Daily SMA100 | 137.36 |
| 3 | Daily SMA200 | 137.01 |
The previous day high was 135.06 while the previous day low was 134.37. The daily 38.2% Fib levels comes at 134.8, expected to provide support. Similarly, the daily 61.8% fib level is at 134.63, expected to provide support.
Note the levels of interest below:
- Pivot support is noted at 134.52, 134.1, 133.83
- Pivot resistance is noted at 135.21, 135.48, 135.91
| Levels | Levels.1 |
|---|---|
| Previous Daily High | 135.06 |
| Previous Daily Low | 134.37 |
| Previous Weekly High | 135.11 |
| Previous Weekly Low | 131.27 |
| Previous Monthly High | 134.78 |
| Previous Monthly Low | 127.22 |
| Daily Fibonacci 38.2% | 134.80 |
| Daily Fibonacci 61.8% | 134.63 |
| Daily Pivot Point S1 | 134.52 |
| Daily Pivot Point S2 | 134.10 |
| Daily Pivot Point S3 | 133.83 |
| Daily Pivot Point R1 | 135.21 |
| Daily Pivot Point R2 | 135.48 |
| Daily Pivot Point R3 | 135.91 |
[/s2If]
Join Our Telegram Group
")


