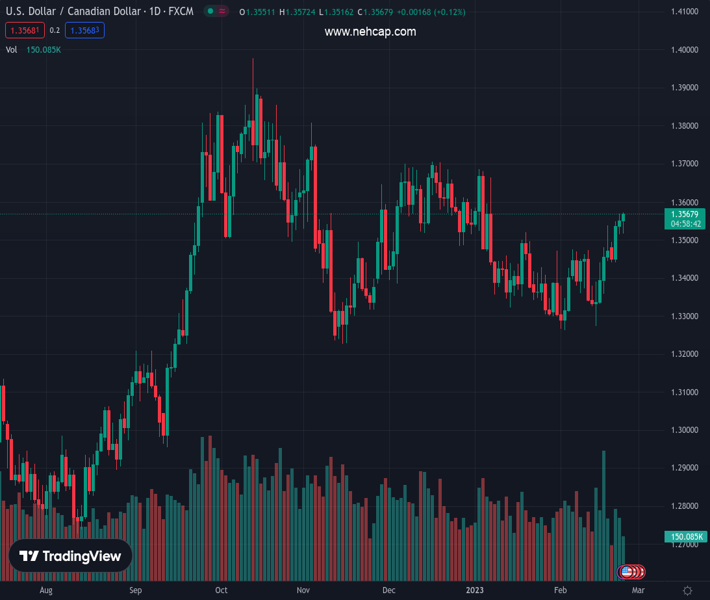
#USDCAD @ 1.35671 aims higher and tests a significant resistance trendline in the daily chart. (Pivot Orderbook analysis)
…
This is a premium post.
[s2If !current_user_can(access_s2member_level4)]Please register for PREMIUM VERSION HERE to read full post below containing analysis. In case of any error or you think you are not able to read the full post below, please email us at support#nehcap.com [lwa][/s2If] [s2If current_user_can(access_s2member_level4)]
- USD/CAD aims higher and tests a significant resistance trendline in the daily chart.
- The latest FOMC minutes suggested that the Fed will continue to hike rates.
- Upbeat US economic data underpinned the US Dollar and bolstered the USD/CAD.
- Rising oil prices capped the USD/CAD rally on Thursday.
The pair currently trades last at 1.35671.
The previous day high was 1.3568 while the previous day low was 1.3515. The daily 38.2% Fib levels comes at 1.3548, expected to provide support. Similarly, the daily 61.8% fib level is at 1.3535, expected to provide support.
The USD/CAD clash with a four-month-old downslope resistance trendline, gaining 0.15% daily. At the time of writing, the USD/CAD exchanges hands at around 1.3565.
Wall Street continues to pare some of its losses. The US Dollar (USD) is gaining some traction as the Federal Reserve is ready to continue tightening monetary conditions, as revealed by the Federal Reserve’s (Fed) last meeting minutes. The minutes showed a slightly hawkish tone as a few officials advocated for a 50 basis point increase in interest rates, but ultimately, they all agreed on a 25 basis point hike. Officials commented that the labor market remains tight and added that growth risks are tilted to the downside.
In the meantime, the US Bureau of Labor Statistics (BLS) revealed that unemployment claims for the week ending on February 18 came at 192K, below last week’s 194K and lower than the 200K expected. Gross Domestic Product (GDP) in the US expanded in the fourth quarter by 2.7%, shy of the first estimate of 2.9%.
The strong growth in the 2022 second half compensated for the 1.1% economic decline during the first six months. Although there was a slowdown in economic activity during the last two months of 2022, it seems the economy has picked up the pace again at the beginning of 2023.
The US Dollar Index (DXY), which tracks the buck’s value vs. six currencies, advances 0.14% at 104.635, the reason for the latest uptick in the USD/CAD pair. Nevertheless, the rally was capped by the jump in oil prices, with WTI’s advancing 2%, trading at $75.32 PB.
On the Canadian front, Average Weekly Earnings eased from 4% to December’s 3.4% YoY. It was the 19th month of growth, with 17 of the 20 sectors reporting gains.
Given the backdrop, the USD/CAD might continue to edge higher. Divergence in monetary policy between the Fed and the Bank of Canada (BoC) warrants further upside in the pair. The BoC announced that it would pause, while Fed officials had stated the need for higher for longer. Therefore, USD/CAD upside is expected.
The USD/CAD pair is testing a four-month-old resistance trendline, drawn from November highs of 1.3808, which passes at around the 1.3560/80 area. Also, the Relative Strength Index (RSI) is still bullish and aiming north, putting at risk the previously-mentioned trendline. Once cleared, the USD/CAD could test 1.3600, followed by the next resistance at 1.3664, the January 6 high.
Technical Levels: Supports and Resistances
USDCAD currently trading at 1.3568 at the time of writing. Pair opened at 1.3556 and is trading with a change of 0.09 % .
| Overview | Overview.1 | |
|---|---|---|
| 0 | Today last price | 1.3568 |
| 1 | Today Daily Change | 0.0012 |
| 2 | Today Daily Change % | 0.0900 |
| 3 | Today daily open | 1.3556 |
The pair remains strongly bullish on the daily timeframe. It trades above its 20 SMA @ 1.3399, 50 SMA 1.3466, 100 SMA @ 1.3515 and 200 SMA @ 1.3256.
| Trends | Trends.1 | |
|---|---|---|
| 0 | Daily SMA20 | 1.3399 |
| 1 | Daily SMA50 | 1.3466 |
| 2 | Daily SMA100 | 1.3515 |
| 3 | Daily SMA200 | 1.3256 |
The previous day high was 1.3568 while the previous day low was 1.3515. The daily 38.2% Fib levels comes at 1.3548, expected to provide support. Similarly, the daily 61.8% fib level is at 1.3535, expected to provide support.
Note the levels of interest below:
- Pivot support is noted at 1.3524, 1.3493, 1.3471
- Pivot resistance is noted at 1.3578, 1.36, 1.3632
| Levels | Levels.1 |
|---|---|
| Previous Daily High | 1.3568 |
| Previous Daily Low | 1.3515 |
| Previous Weekly High | 1.3538 |
| Previous Weekly Low | 1.3274 |
| Previous Monthly High | 1.3685 |
| Previous Monthly Low | 1.3300 |
| Daily Fibonacci 38.2% | 1.3548 |
| Daily Fibonacci 61.8% | 1.3535 |
| Daily Pivot Point S1 | 1.3524 |
| Daily Pivot Point S2 | 1.3493 |
| Daily Pivot Point S3 | 1.3471 |
| Daily Pivot Point R1 | 1.3578 |
| Daily Pivot Point R2 | 1.3600 |
| Daily Pivot Point R3 | 1.3632 |
[/s2If]
Join Our Telegram Group
")


