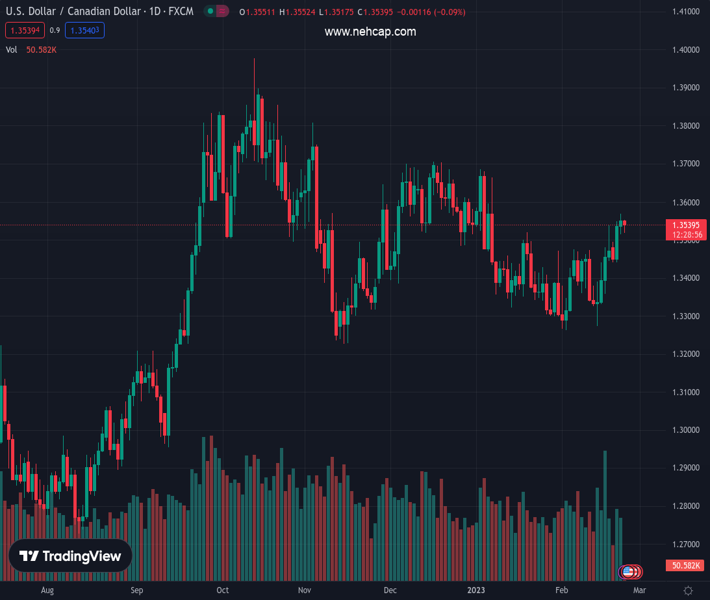
#USDCAD @ 1.35404 retreats from its highest level since January and is pressured by a combination of factors. (Pivot Orderbook analysis)
…
This is a premium post.
[s2If !current_user_can(access_s2member_level4)]Please register for PREMIUM VERSION HERE to read full post below containing analysis. In case of any error or you think you are not able to read the full post below, please email us at support#nehcap.com [lwa][/s2If] [s2If current_user_can(access_s2member_level4)]
- USD/CAD retreats from its highest level since January and is pressured by a combination of factors.
- A modest recovery in Oil prices undermines the Loonie and prompts some selling amid a softer USD.
- Bets for additional Fed rate hikes, recession fears should help limit the USD losses and lend support.
The pair currently trades last at 1.35404.
The previous day high was 1.3568 while the previous day low was 1.3515. The daily 38.2% Fib levels comes at 1.3548, expected to provide resistance. Similarly, the daily 61.8% fib level is at 1.3535, expected to provide support.
The USD/CAD pair comes under some selling pressure on Thursday and moves away from its highest level since January 6, around the 1.3565-1.3570 region touched the previous day. Spot prices remain depressed below mid-1.3500s through the first half of the European session, though manage to defend the 100-day Simple Moving Average (SMA) support.
Crude Oil prices edge higher and reverse a part of the previous day’s slump to over a two-week low amid reports that Russia’s supply cuts will be bigger than previously announced. This, in turn, underpins the commodity-linked Loonie, which, along with a modest US Dollar pullback from a multi-week high, acts as a tailwind for the USD/CAD pair. A slight improvement in the global risk sentiment is seen weighing on the safe-haven Greenback, though the prospects for further policy tightening by the Fed should help limit losses.
In fact, the FOMC minutes released on Wednesday showed that a few participants favoured raising the target range for the federal funds rate by 50 bps or they could have supported it. Adding to this, St. Louis Fed President James Bullard noted the need to get inflation on a sustainable path toward the target this year. This comes after the US CPI and PPI data indicated last week that inflation isn’t coming down quite as fast as hoped. Moreover, the US data pointed to an economy that remains resilient despite rising borrowing costs.
This could allow the Fed to stick to its hawkish stance for longer and supports prospects for the emergence of some dip-buying around the USD. Apart from this, looming recession risks should keep a lid on any optimistic move in the markets and seem to act as a headwind for Crude Oil prices. This further contributes to limiting the downside for the USD/CAD pair. Even from a technical perspective, this week’s sustained break through the 100-day SMA barrier suggests that the path of least resistance for the major is to the upside.
Traders now look to the US economic docket, featuring the release of the Prelim (second estimate) Q4 GDP print and the usual Weekly Initial Jobless Claims later during the early North American session. This, along with the broader risk sentiment, will drive the USD demand and provide some impetus to the USD/CAD pair. Apart from this, Oil price dynamics should further allow traders to grab short-term opportunities around the major.
Technical Levels: Supports and Resistances
USDCAD currently trading at 1.3533 at the time of writing. Pair opened at 1.3556 and is trading with a change of -0.17 % .
| Overview | Overview.1 | |
|---|---|---|
| 0 | Today last price | 1.3533 |
| 1 | Today Daily Change | -0.0023 |
| 2 | Today Daily Change % | -0.1700 |
| 3 | Today daily open | 1.3556 |
The pair remains strongly bullish on the daily timeframe. It trades above its 20 SMA @ 1.3399, 50 SMA 1.3466, 100 SMA @ 1.3515 and 200 SMA @ 1.3256.
| Trends | Trends.1 | |
|---|---|---|
| 0 | Daily SMA20 | 1.3399 |
| 1 | Daily SMA50 | 1.3466 |
| 2 | Daily SMA100 | 1.3515 |
| 3 | Daily SMA200 | 1.3256 |
The previous day high was 1.3568 while the previous day low was 1.3515. The daily 38.2% Fib levels comes at 1.3548, expected to provide resistance. Similarly, the daily 61.8% fib level is at 1.3535, expected to provide support.
Note the levels of interest below:
- Pivot support is noted at 1.3524, 1.3493, 1.3471
- Pivot resistance is noted at 1.3578, 1.36, 1.3632
| Levels | Levels.1 |
|---|---|
| Previous Daily High | 1.3568 |
| Previous Daily Low | 1.3515 |
| Previous Weekly High | 1.3538 |
| Previous Weekly Low | 1.3274 |
| Previous Monthly High | 1.3685 |
| Previous Monthly Low | 1.3300 |
| Daily Fibonacci 38.2% | 1.3548 |
| Daily Fibonacci 61.8% | 1.3535 |
| Daily Pivot Point S1 | 1.3524 |
| Daily Pivot Point S2 | 1.3493 |
| Daily Pivot Point S3 | 1.3471 |
| Daily Pivot Point R1 | 1.3578 |
| Daily Pivot Point R2 | 1.3600 |
| Daily Pivot Point R3 | 1.3632 |
[/s2If]
Join Our Telegram Group
")


