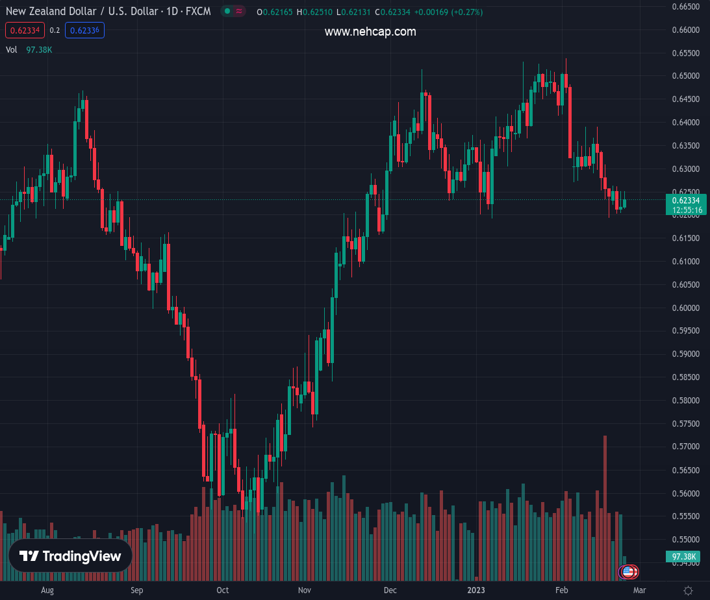
#NZDUSD @ 0.62328 attracts some buying in the vicinity of a technically significant 200-day SMA. (Pivot Orderbook analysis)
…
This is a premium post.
[s2If !current_user_can(access_s2member_level4)]Please register for PREMIUM VERSION HERE to read full post below containing analysis. In case of any error or you think you are not able to read the full post below, please email us at support#nehcap.com [lwa][/s2If] [s2If current_user_can(access_s2member_level4)]
- NZD/USD attracts some buying in the vicinity of a technically significant 200-day SMA.
- A positive risk tone undermines the USD and lends support to the risk-sensitive Kiwi.
- Recession fears, bets for more Fed rate hikes limit the USD losses and cap the major.
The pair currently trades last at 0.62328.
The previous day high was 0.6253 while the previous day low was 0.6205. The daily 38.2% Fib levels comes at 0.6235, expected to provide resistance. Similarly, the daily 61.8% fib level is at 0.6223, expected to provide support.
The NZD/USD pair continues to find support ahead of a technically significant 200-day Simple Moving Average (SMA) and attracts some buyers in the vicinity of the 0.6200 mark on Thursday. The pair sticks to its modest intraday gains through the early European session, albeit lacks bullish conviction and seems to struggle to capitalize on the move beyond the 0.6250 level.
Despite local headwinds from severe flooding and cyclone, the Reserve Bank of New Zealand (RBNZ) raised the official cash rate (OCR) target by 50 bps on Wednesday. Adding to this, RBNZ Governor Adrian Orr said that core inflation is too high and that expectations are elevated. This, in turn, lifts bets for further policy tightening by the central bank and underpins the New Zealand Dollar. Meanwhile, a slight recovery in the global risk sentiment seems to undermine the safe-haven US Dollar and lends support to the NZD/USD pair.
That said, looming recession risks, along with geopolitical tensions, should keep a lid on any optimism in the markets and act as a headwind for the risk-sensitive Kiwi. Furthermore, growing acceptance that the Federal Reserve will continue raising interest rates to control inflation should limit losses for the Greenback and cap the NZD/USD pair. In fact, the FOMC meeting minutes released on Wednesday showed that a few participants favoured raising the target range for the federal funds rate by 50 bps or they could have supported it.
Furthermore, St. Louis Fed President James Bullard noted the need to get inflation on a sustainable path toward the target this year. This comes on the back of the recent robust US macro data, which indicated an economy that remains resilient despite rising borrowing costs and should allow the Fed to stick to its hawkish stance. Moreover, the US CPI and PPI data released last week suggested that inflation isn’t coming down quite as fast as hoped. This, in turn, supports prospects for the emergence of some USD dip-buying.
Hence, it will be prudent to wait for a strong follow-through buying around the NZD/USD pair before confirming that the recent pullback from the highest level since June 2022 has run its course. Traders now look forward to the US economic docket, featuring the release of the Prelim (second estimate) Q4 GDP print and the usual Weekly Initial Jobless Claims later during the early North American session. This, along with the broader risk sentiment, will influence the USD price dynamics and provide some impetus to the NZD/USD pair.
Technical Levels: Supports and Resistances
NZDUSD currently trading at 0.6241 at the time of writing. Pair opened at 0.6218 and is trading with a change of 0.37 % .
| Overview | Overview.1 | |
|---|---|---|
| 0 | Today last price | 0.6241 |
| 1 | Today Daily Change | 0.0023 |
| 2 | Today Daily Change % | 0.3700 |
| 3 | Today daily open | 0.6218 |
The pair is trading below its 20 Daily moving average @ 0.6347, below its 50 Daily moving average @ 0.6354 , above its 100 Daily moving average @ 0.6175 and above its 200 Daily moving average @ 0.6185
| Trends | Trends.1 | |
|---|---|---|
| 0 | Daily SMA20 | 0.6347 |
| 1 | Daily SMA50 | 0.6354 |
| 2 | Daily SMA100 | 0.6175 |
| 3 | Daily SMA200 | 0.6185 |
The previous day high was 0.6253 while the previous day low was 0.6205. The daily 38.2% Fib levels comes at 0.6235, expected to provide resistance. Similarly, the daily 61.8% fib level is at 0.6223, expected to provide support.
Note the levels of interest below:
- Pivot support is noted at 0.6198, 0.6177, 0.615
- Pivot resistance is noted at 0.6246, 0.6273, 0.6294
| Levels | Levels.1 |
|---|---|
| Previous Daily High | 0.6253 |
| Previous Daily Low | 0.6205 |
| Previous Weekly High | 0.6391 |
| Previous Weekly Low | 0.6193 |
| Previous Monthly High | 0.6531 |
| Previous Monthly Low | 0.6190 |
| Daily Fibonacci 38.2% | 0.6235 |
| Daily Fibonacci 61.8% | 0.6223 |
| Daily Pivot Point S1 | 0.6198 |
| Daily Pivot Point S2 | 0.6177 |
| Daily Pivot Point S3 | 0.6150 |
| Daily Pivot Point R1 | 0.6246 |
| Daily Pivot Point R2 | 0.6273 |
| Daily Pivot Point R3 | 0.6294 |
[/s2If]
Join Our Telegram Group
")


