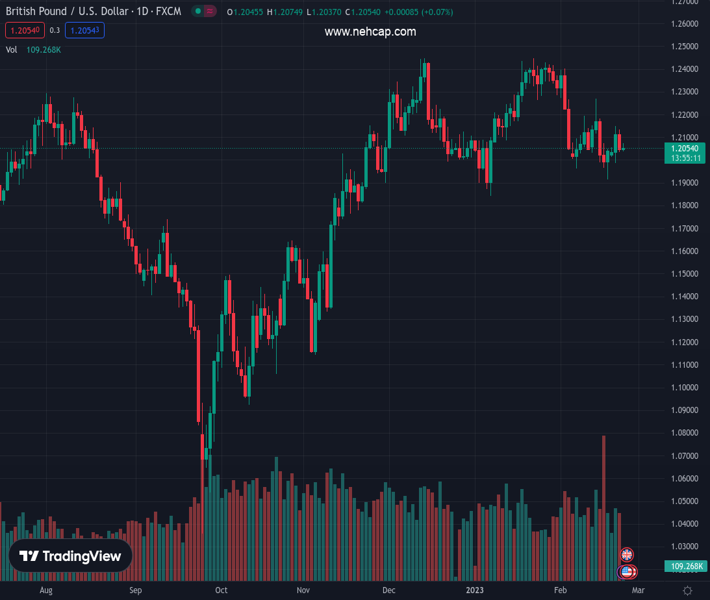
#GBPUSD @ 1.20539 regains positive traction amid a modest USD pullback from a multi-month top. (Pivot Orderbook analysis)
…
This is a premium post.
[s2If !current_user_can(access_s2member_level4)]Please register for PREMIUM VERSION HERE to read full post below containing analysis. In case of any error or you think you are not able to read the full post below, please email us at support#nehcap.com [lwa][/s2If] [s2If current_user_can(access_s2member_level4)]
- GBP/USD regains positive traction amid a modest USD pullback from a multi-month top.
- Signs of stability in the equity markets turn out to be a key factor weighing on the buck.
- Bets for additional BoE rate hikes underpin the GBP and remain supportive of the uptick.
- Hawkish Fed expectations, looming recession risks to limit the USD losses and cap the pair.
The pair currently trades last at 1.20539.
The previous day high was 1.2135 while the previous day low was 1.2035. The daily 38.2% Fib levels comes at 1.2073, expected to provide resistance. Similarly, the daily 61.8% fib level is at 1.2097, expected to provide resistance.
The GBP/USD pair attracts some dip-buying near the 1.2040-1.2035 area on Thursday and reverses a part of the previous day’s downfall. The pair stick to its modest intraday gains through the early European session and is currently placed near the top end of the daily range, around the 1.2065-1.2070 region, through lacks bullish conviction.
Rising bets for additional interest rate hikes by the Bank of England (BoE) act as a tailwind for the British Pound. This, along with a modest US Dollar pullback from a multi-week high, lends some support to the GBP/USD pair. A slight improvement in the global risk sentiment – as depicted by a generally positive tone around the equity markets – undermines the safe-haven buck. That said, a combination of factors should help limit deeper losses for the Greenback and cap the upside for the major.
Investors remain worried about economic headwinds stemming from rapidly rising borrowing costs. This, along with geopolitical tensions, should keep a lid on any optimism in the markets. Apart from this, growing acceptance that the Federal Reserve will continue to raise interest rates to tame persistently high inflation favours the USD bulls. In fact, the FOMC meeting minutes released on Wednesday showed that a few participants favoured raising rates by 50 bps or they could have supported it.
Moreover, the US CPI and PPI data released last week showed that inflation isn’t coming down quite as fast as hoped. Adding to this, the recent robust US macro data pointed to an economy that remains resilient despite rising borrowing costs and should allow the Fed to stick to its hawkish stance. In the absence of any relevant UK economic data, the fundamental backdrop makes it prudent to wait for a strong follow-through buying around the GBP/USD pair before positioning for further intraday appreciating move.
Traders now look to the US economic docket, featuring the release of the Prelim (second estimate) Q4 GDP print and the usual Weekly Initial Jobless Claims later during the early North American session. This, along with the broader risk sentiment, will influence the USD price dynamics and provide some impetus to the GBP/USD pair.
Technical Levels: Supports and Resistances
GBPUSD currently trading at 1.2057 at the time of writing. Pair opened at 1.2043 and is trading with a change of 0.12 % .
| Overview | Overview.1 | |
|---|---|---|
| 0 | Today last price | 1.2057 |
| 1 | Today Daily Change | 0.0014 |
| 2 | Today Daily Change % | 0.1200 |
| 3 | Today daily open | 1.2043 |
The pair is trading below its 20 Daily moving average @ 1.2151, below its 50 Daily moving average @ 1.2156 , above its 100 Daily moving average @ 1.1923 and above its 200 Daily moving average @ 1.1935
| Trends | Trends.1 | |
|---|---|---|
| 0 | Daily SMA20 | 1.2151 |
| 1 | Daily SMA50 | 1.2156 |
| 2 | Daily SMA100 | 1.1923 |
| 3 | Daily SMA200 | 1.1935 |
The previous day high was 1.2135 while the previous day low was 1.2035. The daily 38.2% Fib levels comes at 1.2073, expected to provide resistance. Similarly, the daily 61.8% fib level is at 1.2097, expected to provide resistance.
Note the levels of interest below:
- Pivot support is noted at 1.2007, 1.197, 1.1906
- Pivot resistance is noted at 1.2108, 1.2172, 1.2209
| Levels | Levels.1 |
|---|---|
| Previous Daily High | 1.2135 |
| Previous Daily Low | 1.2035 |
| Previous Weekly High | 1.2270 |
| Previous Weekly Low | 1.1915 |
| Previous Monthly High | 1.2448 |
| Previous Monthly Low | 1.1841 |
| Daily Fibonacci 38.2% | 1.2073 |
| Daily Fibonacci 61.8% | 1.2097 |
| Daily Pivot Point S1 | 1.2007 |
| Daily Pivot Point S2 | 1.1970 |
| Daily Pivot Point S3 | 1.1906 |
| Daily Pivot Point R1 | 1.2108 |
| Daily Pivot Point R2 | 1.2172 |
| Daily Pivot Point R3 | 1.2209 |
[/s2If]
Join Our Telegram Group
")


