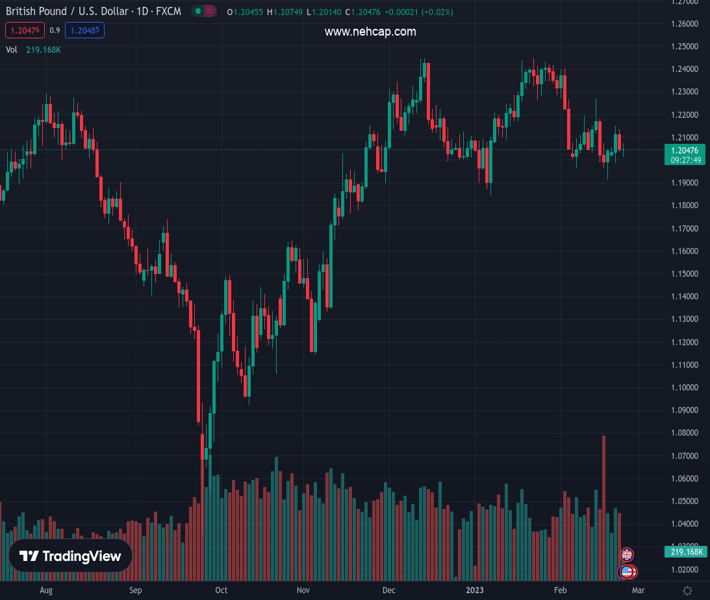
#GBPUSD @ 1.20463 turns lower for the second successive day, though lacks follow-through selling. (Pivot Orderbook analysis)
…
This is a premium post.
[s2If !current_user_can(access_s2member_level4)]Please register for PREMIUM VERSION HERE to read full post below containing analysis. In case of any error or you think you are not able to read the full post below, please email us at support#nehcap.com [lwa][/s2If] [s2If current_user_can(access_s2member_level4)]
- GBP/USD turns lower for the second successive day, though lacks follow-through selling.
- Hawkish Fed expectations, elevated US bond yields underpin the USD and exert pressure.
- A positive risk tone caps the buck and acts as a tailwind amid bets for more BoE rate hikes.
The pair currently trades last at 1.20463.
The previous day high was 1.2135 while the previous day low was 1.2035. The daily 38.2% Fib levels comes at 1.2073, expected to provide resistance. Similarly, the daily 61.8% fib level is at 1.2097, expected to provide resistance.
The GBP/USD pair meets with a fresh supply following an intraday uptick to the 1.2075 region and drops to a fresh daily low during the mid-European session. Spot prices manage to rebound from the vicinity of the 1.2000 psychological mark and now seem to have stabilized in neutral territory, just below the 1.2050 area.
The US Dollar remains pinned near a multi-week high, which, in turn, is seen as a key factor exerting some downward pressure on the GBP/USD pair. The FOMC meeting minutes released on Wednesday reaffirmed market expectations that the US central bank will continue to continue to tighten its monetary policy to tame stubbornly high inflation. Furthermore, the recent upbeat US macro data pointed to an economy that remains resilient despite rising borrowing costs and should allow the Fed to stick to its hawkish stance.
In fact, the markets are now pricing in at least a 25 bps lift-off at the next three FOMC policy meetings. This, in turn, assists the US Treasury bond yields to hold steady near the YTD peak and continues to underpin the Greenback. That said, a modest recovery in the global risk sentiment – as depicted by a generally positive tone around the equity markets – keeps a lid on the safe-haven buck. Apart from this, rising bets for additional interest rate hikes by the Bank of England (BoE) contribute to limiting losses for the GBP/USD pair.
The UK PMIs released on Tuesday indicated that business activity rose more than expected in February and fueled optimism that the country may be able to avoid a steep economic downturn. This, in turn, could persuade the BoE to keep its foot on the accelerator in its race against inflation. Hence, it will be prudent to wait for a sustained break below the 1.2000 mark before confirming that the GBP/USD pair’s recent bounce from a technically significant 200-day Simple Moving Average (SMA) has already run out of steam.
Next on tap is the US economic docket, featuring the release of the Prelim (second estimate) Q4 GDP print and the usual Weekly Initial Jobless Claims. Traders will further take cues from comments by influential FOMC members – Atlanta Fed President Raphael Bostic and San Francisco Fed President Mary Daly. This, along with the US bond yields and the broader risk sentiment, will drive the USD and provide some impetus to the GBP/USD pair.
Technical Levels: Supports and Resistances
GBPUSD currently trading at 1.203 at the time of writing. Pair opened at 1.2043 and is trading with a change of -0.11 % .
| Overview | Overview.1 | |
|---|---|---|
| 0 | Today last price | 1.2030 |
| 1 | Today Daily Change | -0.0013 |
| 2 | Today Daily Change % | -0.1100 |
| 3 | Today daily open | 1.2043 |
The pair is trading below its 20 Daily moving average @ 1.2151, below its 50 Daily moving average @ 1.2156 , above its 100 Daily moving average @ 1.1923 and above its 200 Daily moving average @ 1.1935
| Trends | Trends.1 | |
|---|---|---|
| 0 | Daily SMA20 | 1.2151 |
| 1 | Daily SMA50 | 1.2156 |
| 2 | Daily SMA100 | 1.1923 |
| 3 | Daily SMA200 | 1.1935 |
The previous day high was 1.2135 while the previous day low was 1.2035. The daily 38.2% Fib levels comes at 1.2073, expected to provide resistance. Similarly, the daily 61.8% fib level is at 1.2097, expected to provide resistance.
Note the levels of interest below:
- Pivot support is noted at 1.2007, 1.197, 1.1906
- Pivot resistance is noted at 1.2108, 1.2172, 1.2209
| Levels | Levels.1 |
|---|---|
| Previous Daily High | 1.2135 |
| Previous Daily Low | 1.2035 |
| Previous Weekly High | 1.2270 |
| Previous Weekly Low | 1.1915 |
| Previous Monthly High | 1.2448 |
| Previous Monthly Low | 1.1841 |
| Daily Fibonacci 38.2% | 1.2073 |
| Daily Fibonacci 61.8% | 1.2097 |
| Daily Pivot Point S1 | 1.2007 |
| Daily Pivot Point S2 | 1.1970 |
| Daily Pivot Point S3 | 1.1906 |
| Daily Pivot Point R1 | 1.2108 |
| Daily Pivot Point R2 | 1.2172 |
| Daily Pivot Point R3 | 1.2209 |
[/s2If]
Join Our Telegram Group
")


