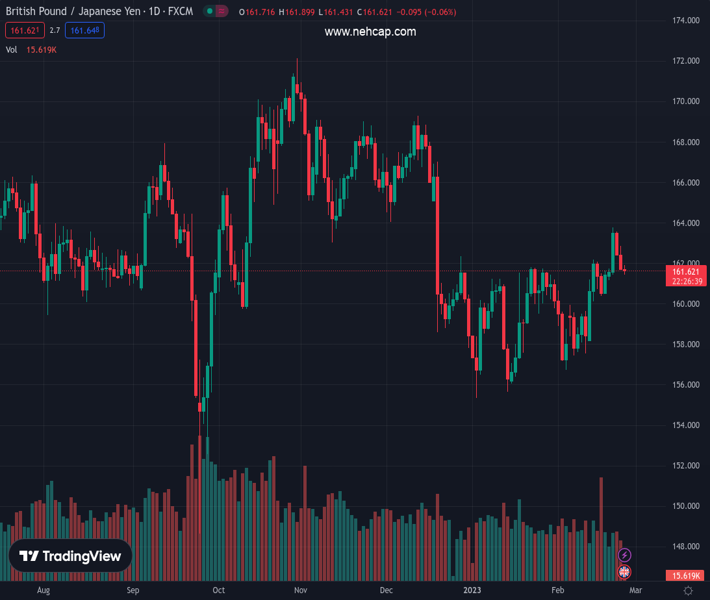
#GBPJPY @ 161.791 slid below crucial daily EMAs, namely the 200 and the 100-day EMAs. (Pivot Orderbook analysis)
…
This is a premium post.
[s2If !current_user_can(access_s2member_level4)]Please register for PREMIUM VERSION HERE to read full post below containing analysis. In case of any error or you think you are not able to read the full post below, please email us at support#nehcap.com [lwa][/s2If] [s2If current_user_can(access_s2member_level4)]
- GBP/JPY slid below crucial daily EMAs, namely the 200 and the 100-day EMAs.
- The GBP/JPY must crack the 161.00 figure for a bearish continuation.
- On the other hand, GBP/JPY buyers reclaiming 162.00 could pave the way for further upside.
The pair currently trades last at 161.791.
The previous day high was 163.57 while the previous day low was 162.4. The daily 38.2% Fib levels comes at 162.84, expected to provide resistance. Similarly, the daily 61.8% fib level is at 163.12, expected to provide resistance.
The GBP/JPY registers minuscule gains as Friday’s Asian session begins after tumbling below the 200 and 100-day Exponential Moving Averages (EMAs), at 161.82 and 161.98, respectively. After forming a dark cloud cover and missing to hold to 162.00, the GBP/JPY is trading at around 161.70.
GBP/JPY Thursday’s price action changed the pair’s bias as sellers reclaimed solid support areas, which turned to resistance. Although the Relative Strength Index (RSI) is in bullish territory, its slope aims downwards, suggesting that sellers are gaining momentum. Still, the Rate of Change (RoC) suggests the opposite, that buyers are moving in. Therefore, the GBP/JPY bias is neutral.
For a GBP/JPY bearish continuation, traders must drag prices toward the 50-day EMA at 161.10. Once cleared, the GBP/JPY might test the 20-day EMA at 160.87 before dropping to the 160.00 figure.
As an alternate scenario, if the GBP/JPY reclaims 162.30, that could open the door for further upside. Hence, the GBP/JPY first resistance would be the February 23 daily high at 162.85. The next stop would be the weekly high at 163.75 before testing a major five-month-old downslope trendline that passes around.
Technical Levels: Supports and Resistances
GBPJPY currently trading at 161.65 at the time of writing. Pair opened at 162.53 and is trading with a change of -0.54 % .
| Overview | Overview.1 | |
|---|---|---|
| 0 | Today last price | 161.65 |
| 1 | Today Daily Change | -0.88 |
| 2 | Today Daily Change % | -0.54 |
| 3 | Today daily open | 162.53 |
The pair is trading above its 20 Daily moving average @ 160.33, above its 50 Daily moving average @ 160.27 , below its 100 Daily moving average @ 163.55 and below its 200 Daily moving average @ 163.32
| Trends | Trends.1 | |
|---|---|---|
| 0 | Daily SMA20 | 160.33 |
| 1 | Daily SMA50 | 160.27 |
| 2 | Daily SMA100 | 163.55 |
| 3 | Daily SMA200 | 163.32 |
The previous day high was 163.57 while the previous day low was 162.4. The daily 38.2% Fib levels comes at 162.84, expected to provide resistance. Similarly, the daily 61.8% fib level is at 163.12, expected to provide resistance.
Note the levels of interest below:
- Pivot support is noted at 162.09, 161.66, 160.92
- Pivot resistance is noted at 163.27, 164.0, 164.44
| Levels | Levels.1 |
|---|---|
| Previous Daily High | 163.57 |
| Previous Daily Low | 162.40 |
| Previous Weekly High | 162.18 |
| Previous Weekly Low | 158.40 |
| Previous Monthly High | 161.85 |
| Previous Monthly Low | 155.36 |
| Daily Fibonacci 38.2% | 162.84 |
| Daily Fibonacci 61.8% | 163.12 |
| Daily Pivot Point S1 | 162.09 |
| Daily Pivot Point S2 | 161.66 |
| Daily Pivot Point S3 | 160.92 |
| Daily Pivot Point R1 | 163.27 |
| Daily Pivot Point R2 | 164.00 |
| Daily Pivot Point R3 | 164.44 |
[/s2If]
Join Our Telegram Group
")


