#AUDUSD @ 0.68222 struggles to capitalize on its modest intraday gains amid a modest USD uptick. (Pivot Orderbook analysis)
…
This is a premium post.
[s2If !current_user_can(access_s2member_level4)]Please register for PREMIUM VERSION HERE to read full post below containing analysis. In case of any error or you think you are not able to read the full post below, please email us at support#nehcap.com [lwa][/s2If] [s2If current_user_can(access_s2member_level4)]
- AUD/USD struggles to capitalize on its modest intraday gains amid a modest USD uptick.
- Bets for more rate hikes by the Fed push the US bond yields higher and underpin the buck.
- A positive risk tone caps the safe-haven USD and lends support to the risk-sensitive Aussie.
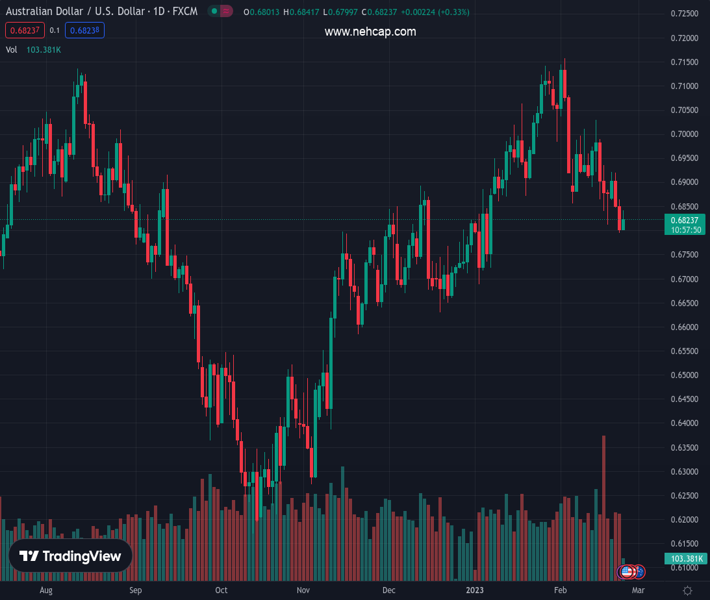
The pair currently trades last at 0.68222.
The previous day high was 0.6865 while the previous day low was 0.6795. The daily 38.2% Fib levels comes at 0.6822, expected to provide support. Similarly, the daily 61.8% fib level is at 0.6838, expected to provide resistance.
The AUD/USD pair trims a part of its modest intraday gains and retreats to the lower end of the daily range during the first half of the European session. Spot prices, however, manage to hold above the 0.6800 mark, representing a technically significant 200-day Simple Moving Average (SMA), and remain at the mercy of the US Dollar price dynamics.
In fact, the USD Index, which tracks the Greenback against a basket of currencies, stands tall near a multi-week high amid the prospects for further policy tightening by the Fed. The bets were reaffirmed by hawkish FOMC meeting minutes released on Wednesday, showing that policymakers were determined to raise rates further to tame stubbornly high inflation. Furthermore, St. Louis Fed President James Bullard pointed to the need to get inflation on a sustainable path toward the target this year.
It is worth recalling that the US CPI and PPI data indicated last week that inflation isn’t coming down quite as fast as hoped. Moreover, the recent upbeat US macro data pointed to an economy that remains resilient despite rising borrowing costs and should allow the US central bank to stick to its hawkish stance. This, in turn, remains supportive of elevated US Treasury bond yields and underpins the buck. That said, a modest recovery in the risk sentiment lends support to the risk-sensitive Aussie.
Even from a technical perspective, the AUD/USD pair has been showing some resilience near the very important 200-day SMA support, currently around the 0.6800 mark. This makes it prudent to wait for a sustained break through the said handle before positioning for an extension of the recent pullback from the highest level since June 2022 touched earlier this month. The focus now shifts to the US economic docket – featuring the Prelim Q4 GDP print and the usual Weekly Initial Jobless Claims data.
Traders will further Apart from this, comments by influential FOMC members – Atlanta Fed President Raphael Bostic and San Francisco Fed President Mary Daly. This, along with the US bond yields and the broader market risk sentiment, will drive the USD demand and provide some meaningful impetus to the AUD/USD pair. Nevertheless, the fundamental backdrop seems tilted in favour of bearish traders and suggests that the path of least resistance for spot prices is to the downside
Technical Levels: Supports and Resistances
AUDUSD currently trading at 0.6821 at the time of writing. Pair opened at 0.6805 and is trading with a change of 0.24 % .
| Overview | Overview.1 | |
|---|---|---|
| 0 | Today last price | 0.6821 |
| 1 | Today Daily Change | 0.0016 |
| 2 | Today Daily Change % | 0.2400 |
| 3 | Today daily open | 0.6805 |
The pair is trading below its 20 Daily moving average @ 0.6965, below its 50 Daily moving average @ 0.689 , above its 100 Daily moving average @ 0.6718 and above its 200 Daily moving average @ 0.6804
| Trends | Trends.1 | |
|---|---|---|
| 0 | Daily SMA20 | 0.6965 |
| 1 | Daily SMA50 | 0.6890 |
| 2 | Daily SMA100 | 0.6718 |
| 3 | Daily SMA200 | 0.6804 |
The previous day high was 0.6865 while the previous day low was 0.6795. The daily 38.2% Fib levels comes at 0.6822, expected to provide support. Similarly, the daily 61.8% fib level is at 0.6838, expected to provide resistance.
Note the levels of interest below:
- Pivot support is noted at 0.6778, 0.6752, 0.6708
- Pivot resistance is noted at 0.6848, 0.6891, 0.6918
| Levels | Levels.1 |
|---|---|
| Previous Daily High | 0.6865 |
| Previous Daily Low | 0.6795 |
| Previous Weekly High | 0.7030 |
| Previous Weekly Low | 0.6812 |
| Previous Monthly High | 0.7143 |
| Previous Monthly Low | 0.6688 |
| Daily Fibonacci 38.2% | 0.6822 |
| Daily Fibonacci 61.8% | 0.6838 |
| Daily Pivot Point S1 | 0.6778 |
| Daily Pivot Point S2 | 0.6752 |
| Daily Pivot Point S3 | 0.6708 |
| Daily Pivot Point R1 | 0.6848 |
| Daily Pivot Point R2 | 0.6891 |
| Daily Pivot Point R3 | 0.6918 |
[/s2If]
Join Our Telegram Group
")


