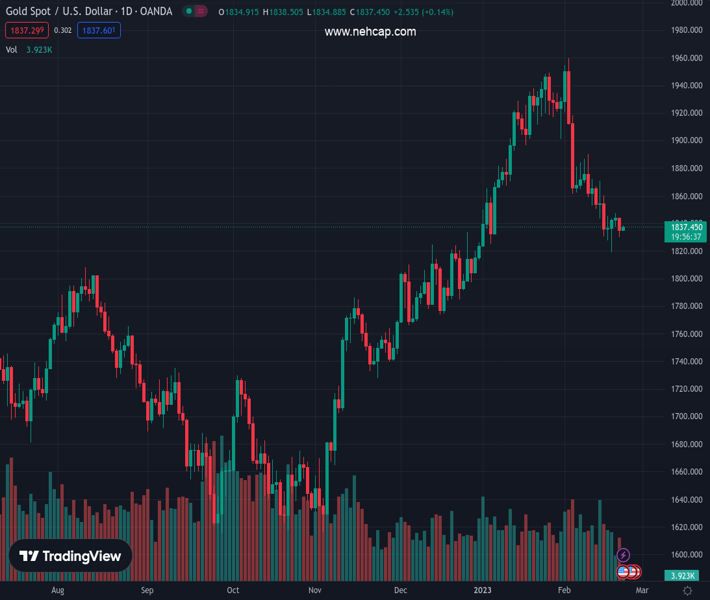
#XAUUSD @ 1,836.89 Gold price has scaled above $1,840.00 as the USD Index has sensed a minor correction. (Pivot Orderbook analysis)
…
This is a premium post.
[s2If !current_user_can(access_s2member_level4)]Please register for PREMIUM VERSION HERE to read full post below containing analysis. In case of any error or you think you are not able to read the full post below, please email us at support#nehcap.com [lwa][/s2If] [s2If current_user_can(access_s2member_level4)]
- Gold price has scaled above $1,840.00 as the USD Index has sensed a minor correction.
- Investors will look for cues that will provide guidance on terminal rate and inflation projections from the FOMC minutes.
- Gold price is auctioning in a Symmetrical Triangle chart pattern that indicates a sheer volatility contraction.
The pair currently trades last at 1836.89.
The previous day high was 1843.9 while the previous day low was 1830.3. The daily 38.2% Fib levels comes at 1835.5, expected to provide support. Similarly, the daily 61.8% fib level is at 1838.7, expected to provide resistance.
Gold price (XAU/USD) has attempted a break above $1,838.00 despite the anxiety among the market participants ahead of the release of the Federal Open Market Committee (FOMC) minutes. The precious metal is broadly showing a volatility contraction as investors are refraining themselves from building aggressive positions ahead of the FOMC minutes release.
Some gains have been scored by the S&P500 futures after the index dived on Tuesday amid fears that the Federal Reserve’s (Fed) monetary policy is not restrictive enough to tame the stubborn inflation. However, the market participants still need to be precautionary as the overall market mood is quite risk-averse.
The US Dollar Index (DXY) is attempting to rebound after a mild correction to near 103.70. Meanwhile, the yields on US government bonds have corrected minutely. The 10-year US Treasury yields have dropped below 3.95%, however, the upside seems favored amid hawkish Fed bets.
Investors are shifting their focus completely towards the release of the FOMC minutes, which will provide a detailed explanation of the 25 bps interest rate hike in February’s monetary policy meeting. Apart from that, investors will look for cues that will provide guidance on terminal rate and inflation projections for the mid-term and for a longer horizon.
Gold price is auctioning in a Symmetrical Triangle chart pattern that indicates a sheer volatility contraction on an hourly scale. The downward-sloping trendline of the above-mentioned chart pattern is placed from February 20 high at $1,847.59 while the upward-sloping trendline is placed from February 17 low at $1,818.93.
The 20-period Exponential Moving Average (EMA) at $1,836.33 is overlapping on the asset price, which indicates indecisiveness in the sentiment of the market participants.
Meanwhile, the Relative Strength Index (RSI) (14) is oscillating in the 40.00-60.00, which signals a lackluster performance ahead.
Technical Levels: Supports and Resistances
XAUUSD currently trading at 1837.72 at the time of writing. Pair opened at 1834.76 and is trading with a change of 0.16 % .
| Overview | Overview.1 | |
|---|---|---|
| 0 | Today last price | 1837.72 |
| 1 | Today Daily Change | 2.96 |
| 2 | Today Daily Change % | 0.16 |
| 3 | Today daily open | 1834.76 |
The pair is trading below its 20 Daily moving average @ 1881.35, below its 50 Daily moving average @ 1863.68 , above its 100 Daily moving average @ 1789.0 and above its 200 Daily moving average @ 1776.24
| Trends | Trends.1 | |
|---|---|---|
| 0 | Daily SMA20 | 1881.35 |
| 1 | Daily SMA50 | 1863.68 |
| 2 | Daily SMA100 | 1789.00 |
| 3 | Daily SMA200 | 1776.24 |
The previous day high was 1843.9 while the previous day low was 1830.3. The daily 38.2% Fib levels comes at 1835.5, expected to provide support. Similarly, the daily 61.8% fib level is at 1838.7, expected to provide resistance.
Note the levels of interest below:
- Pivot support is noted at 1828.74, 1822.72, 1815.14
- Pivot resistance is noted at 1842.34, 1849.92, 1855.94
| Levels | Levels.1 |
|---|---|
| Previous Daily High | 1843.90 |
| Previous Daily Low | 1830.30 |
| Previous Weekly High | 1870.71 |
| Previous Weekly Low | 1818.93 |
| Previous Monthly High | 1949.27 |
| Previous Monthly Low | 1823.76 |
| Daily Fibonacci 38.2% | 1835.50 |
| Daily Fibonacci 61.8% | 1838.70 |
| Daily Pivot Point S1 | 1828.74 |
| Daily Pivot Point S2 | 1822.72 |
| Daily Pivot Point S3 | 1815.14 |
| Daily Pivot Point R1 | 1842.34 |
| Daily Pivot Point R2 | 1849.92 |
| Daily Pivot Point R3 | 1855.94 |
[/s2If]
Join Our Telegram Group
")


