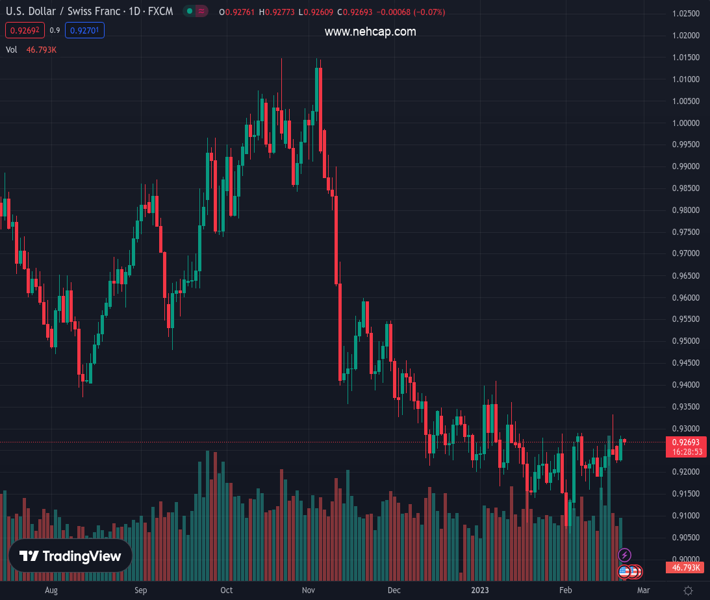
#USDCHF @ 0.92695 pares the biggest daily gains in three weeks by reversing from golden Fibonacci ratio., @nehcap view: Further upside expected (Pivot Orderbook analysis)
…
This is a premium post.
[s2If !current_user_can(access_s2member_level4)]Please register for PREMIUM VERSION HERE to read full post below containing analysis. In case of any error or you think you are not able to read the full post below, please email us at support#nehcap.com [lwa][/s2If] [s2If current_user_can(access_s2member_level4)]
- USD/CHF pares the biggest daily gains in three weeks by reversing from golden Fibonacci ratio.
- Multiple trend lines, 200-SMA stand tall to challenge downside move, RSI conditions also suggest further grinding towards the north.
- Buyers seem to have a smooth road ahead of 0.9350 hurdle.
The pair currently trades last at 0.92695.
The previous day high was 0.9283 while the previous day low was 0.9228. The daily 38.2% Fib levels comes at 0.9262, expected to provide support. Similarly, the daily 61.8% fib level is at 0.9249, expected to provide support.
USD/CHF seesaws around 0.9265 as it consolidates the previous day’s gains with mild losses heading into Wednesday’s European session. In doing so, the Swiss Franc (CHF) pair makes a U-turn from the 61.8% Fibonacci retracement level, also known as the golden Fibonacci ratio, to pare the biggest daily jump since early February.
Even so, the most steady RSI (14), above 50, joins the bullish MACD signals, despite being sluggish of late, to keep the USD/CHF buyers hopeful.
That said, a one-week-old ascending trend line restricts the immediate downside of the USD/CHF pair near 0.9245.
Following that, the 50% Fibonacci retracement level and the 200-SMA could probe the bears around 0.9235 and 0.9220 in that order.
It’s worth noting that an upward-sloping support line from February 01, close to 0.9185 at the latest, appears the last defense of the USD/CHF bulls.
On the flip side, a clear break of the aforementioned key Fibonacci retracement level of 0.9275 could quickly propel the USD/CHF prices toward the 0.9300 round figure before highlighting the latest swing top near 0.9335.
Though, multiple hurdles near 0.9350 seem to challenge the USD/CHF pair’s upside past 0.9335, a break of which could easily challenge the previous monthly high surrounding 0.9490.
Trend: Further upside expected
Technical Levels: Supports and Resistances
USDCHF currently trading at 0.9264 at the time of writing. Pair opened at 0.9276 and is trading with a change of -0.13% % .
| Overview | Overview.1 | |
|---|---|---|
| 0 | Today last price | 0.9264 |
| 1 | Today Daily Change | -0.0012 |
| 2 | Today Daily Change % | -0.13% |
| 3 | Today daily open | 0.9276 |
The pair is trading above its 20 Daily moving average @ 0.9216, above its 50 Daily moving average @ 0.9247 , below its 100 Daily moving average @ 0.9481 and below its 200 Daily moving average @ 0.9579
| Trends | Trends.1 | |
|---|---|---|
| 0 | Daily SMA20 | 0.9216 |
| 1 | Daily SMA50 | 0.9247 |
| 2 | Daily SMA100 | 0.9481 |
| 3 | Daily SMA200 | 0.9579 |
The previous day high was 0.9283 while the previous day low was 0.9228. The daily 38.2% Fib levels comes at 0.9262, expected to provide support. Similarly, the daily 61.8% fib level is at 0.9249, expected to provide support.
Note the levels of interest below:
- Pivot support is noted at 0.9242, 0.9208, 0.9188
- Pivot resistance is noted at 0.9297, 0.9317, 0.9352
| Levels | Levels.1 |
|---|---|
| Previous Daily High | 0.9283 |
| Previous Daily Low | 0.9228 |
| Previous Weekly High | 0.9332 |
| Previous Weekly Low | 0.9138 |
| Previous Monthly High | 0.9410 |
| Previous Monthly Low | 0.9085 |
| Daily Fibonacci 38.2% | 0.9262 |
| Daily Fibonacci 61.8% | 0.9249 |
| Daily Pivot Point S1 | 0.9242 |
| Daily Pivot Point S2 | 0.9208 |
| Daily Pivot Point S3 | 0.9188 |
| Daily Pivot Point R1 | 0.9297 |
| Daily Pivot Point R2 | 0.9317 |
| Daily Pivot Point R3 | 0.9352 |
[/s2If]
Join Our Telegram Group
")


