Oil price is declining towards $75.50 as the expectations for more rate hikes by the Fed are escalating. (Pivot Orderbook analysis)
…
This is a premium post.
[s2If !current_user_can(access_s2member_level4)]Please register for PREMIUM VERSION HERE to read full post below containing analysis. In case of any error or you think you are not able to read the full post below, please email us at support#nehcap.com [lwa][/s2If] [s2If current_user_can(access_s2member_level4)]
- Oil price is declining towards $75.50 as the expectations for more rate hikes by the Fed are escalating.
- Producers in China are failing to lift the WPI from deflation, indicating that the retail demand is still stagnant.
- The oil inventory data by the US API will be keenly watched.
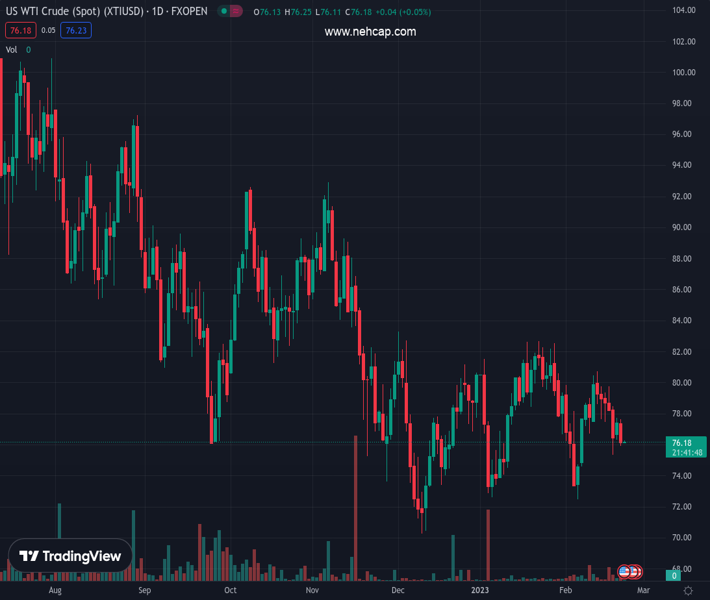
The pair currently trades last at 76.25.
The previous day high was 77.65 while the previous day low was 75.94. The daily 38.2% Fib levels comes at 76.59, expected to provide resistance. Similarly, the daily 61.8% fib level is at 77.0, expected to provide resistance.
West Texas Intermediate (WTI), futures on NYMEX, have dropped after failing to surpass the critical resistance of $77.50. The oil price is expected to extend its downside to near $75.50 as investors are worried that accelerating chances of further policy tightening by the Federal Reserve (Fed) will strengthen recession fears in the United States.
The release of the upbeat preliminary S&P US PMI data was loud and clear that economic activities are routing to the expansionary road led by solid consumer spending. A sheer recovery in retail demand could renew the fears of a rebound in inflationary pressures. Also, Fed chair Jerome Powell has already cleared that inflation is persistent and the consideration of a pause in policy tightening would be premature.
On Wednesday, the release of the Federal Open Market Committee (FOMC) minutes will determine what authorities are planning for the terminal rate and targets decided for inflation for the current year and a roadmap for achieving the 2% inflation target.
The US Dollar Index (DXY) is gathering strength to deliver a break above the immediate resistance of 103.90 amid the risk aversion theme.
Meanwhile, fading hopes of a sheer recovery in China after lifting the pandemic controls by the administration is impacting the oil price. Producers are failing to lift the Wholesale Price Index (WPI) from deflation, which indicates that the retail demand is still stagnant. Therefore, the inability of the Chinese government in spurting the overall demand despite releasing helicopter money is barricading the black gold.
Wednesday’s release of the weekly crude stockpiles for the week ending February 17 by the US American Petroleum Institute (API) will be keenly watched. The inventory data is delayed to Wednesday as US markets were closed on Monday on account of Presidents’ Day.
Technical Levels: Supports and Resistances
XTIUSD currently trading at 76.25 at the time of writing. Pair opened at 76.13 and is trading with a change of 0.16 % .
| Overview | Overview.1 | |
|---|---|---|
| 0 | Today last price | 76.25 |
| 1 | Today Daily Change | 0.12 |
| 2 | Today Daily Change % | 0.16 |
| 3 | Today daily open | 76.13 |
The pair remains strongly bearish on the daily time frame. It trades below the 20 SMA @ 77.98, 50 SMA 78.06, 100 SMA @ 80.67 and 200 SMA @ 89.1.
| Trends | Trends.1 | |
|---|---|---|
| 0 | Daily SMA20 | 77.98 |
| 1 | Daily SMA50 | 78.06 |
| 2 | Daily SMA100 | 80.67 |
| 3 | Daily SMA200 | 89.10 |
The previous day high was 77.65 while the previous day low was 75.94. The daily 38.2% Fib levels comes at 76.59, expected to provide resistance. Similarly, the daily 61.8% fib level is at 77.0, expected to provide resistance.
Note the levels of interest below:
- Pivot support is noted at 75.49, 74.85, 73.77
- Pivot resistance is noted at 77.21, 78.29, 78.93
| Levels | Levels.1 |
|---|---|
| Previous Daily High | 77.65 |
| Previous Daily Low | 75.94 |
| Previous Weekly High | 80.75 |
| Previous Weekly Low | 75.34 |
| Previous Monthly High | 82.68 |
| Previous Monthly Low | 72.64 |
| Daily Fibonacci 38.2% | 76.59 |
| Daily Fibonacci 61.8% | 77.00 |
| Daily Pivot Point S1 | 75.49 |
| Daily Pivot Point S2 | 74.85 |
| Daily Pivot Point S3 | 73.77 |
| Daily Pivot Point R1 | 77.21 |
| Daily Pivot Point R2 | 78.29 |
| Daily Pivot Point R3 | 78.93 |
[/s2If]
Join Our Telegram Group
")


