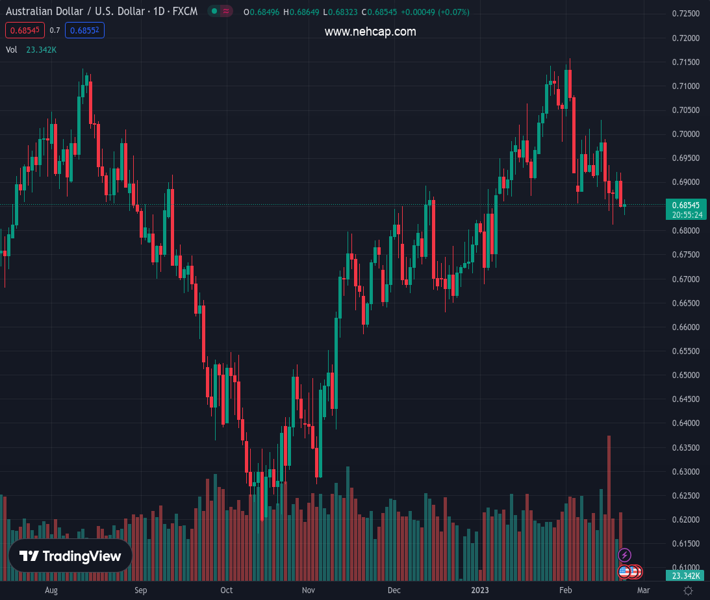
#AUDUSD @ 0.68583 licks its wounds after falling the most in a week., @nehcap view: Further downside expected (Pivot Orderbook analysis)
…
This is a premium post.
[s2If !current_user_can(access_s2member_level4)]Please register for PREMIUM VERSION HERE to read full post below containing analysis. In case of any error or you think you are not able to read the full post below, please email us at support#nehcap.com [lwa][/s2If] [s2If current_user_can(access_s2member_level4)]
- AUD/USD licks its wounds after falling the most in a week.
- Clear U-turn from three-week-old resistance line, 50-SMA joins bearish MACD signals to suggest further downside.
- Ascending trend line from the last Friday restricts immediate downside of Aussie pair.
- Previous support line from December, 100-SMA add to the upside filters.
The pair currently trades last at 0.68583.
The previous day high was 0.692 while the previous day low was 0.6848. The daily 38.2% Fib levels comes at 0.6875, expected to provide resistance. Similarly, the daily 61.8% fib level is at 0.6892, expected to provide resistance.
AUD/USD remains sidelined near 0.6860, printing mild gains by the press time of Wednesday’s Asian session, as bears take a breather following the biggest daily slump since the last Wednesday.
Even so, the Aussie pair keeps the previous week’s retreat from a downward-sloping resistance line from February 02, as well as the 50-SMA, amid a bearish MACD signal.
Also adding strength to the downside bias is the sustained trading below the support-turned-resistance line from late December 2022.
However, an upward-sloping support line from the last Friday, close to 0.6850 by the press time, restricts the immediate downside of the AUD/USD pair.
Following that, the 61.8% Fibonacci retracement level of the pair’s run-up from December 2022 to early February 2023, near 0.6830, will precede the monthly low of 0.6811 to challenge the AUD/USD bears before giving them control.
On the contrary, the aforementioned three-week-old descending resistance line, near 0.6900, as well as the 50-SMA level of around 0.6910, guard short-term AUD/USD recovery ahead of the multi-day-old previous support line, close to 0.6935 at the latest.
It should be noted that the 100-SMA level of 0.6950 acts as the last defense of the AUD/USD pair bears.
Trend: Further downside expected
Technical Levels: Supports and Resistances
AUDUSD currently trading at 0.6862 at the time of writing. Pair opened at 0.6854 and is trading with a change of 0.12% % .
| Overview | Overview.1 | |
|---|---|---|
| 0 | Today last price | 0.6862 |
| 1 | Today Daily Change | 0.0008 |
| 2 | Today Daily Change % | 0.12% |
| 3 | Today daily open | 0.6854 |
The pair is trading below its 20 Daily moving average @ 0.698, below its 50 Daily moving average @ 0.6891 , above its 100 Daily moving average @ 0.6715 and above its 200 Daily moving average @ 0.6805
| Trends | Trends.1 | |
|---|---|---|
| 0 | Daily SMA20 | 0.6980 |
| 1 | Daily SMA50 | 0.6891 |
| 2 | Daily SMA100 | 0.6715 |
| 3 | Daily SMA200 | 0.6805 |
The previous day high was 0.692 while the previous day low was 0.6848. The daily 38.2% Fib levels comes at 0.6875, expected to provide resistance. Similarly, the daily 61.8% fib level is at 0.6892, expected to provide resistance.
Note the levels of interest below:
- Pivot support is noted at 0.6828, 0.6802, 0.6756
- Pivot resistance is noted at 0.69, 0.6946, 0.6973
| Levels | Levels.1 |
|---|---|
| Previous Daily High | 0.6920 |
| Previous Daily Low | 0.6848 |
| Previous Weekly High | 0.7030 |
| Previous Weekly Low | 0.6812 |
| Previous Monthly High | 0.7143 |
| Previous Monthly Low | 0.6688 |
| Daily Fibonacci 38.2% | 0.6875 |
| Daily Fibonacci 61.8% | 0.6892 |
| Daily Pivot Point S1 | 0.6828 |
| Daily Pivot Point S2 | 0.6802 |
| Daily Pivot Point S3 | 0.6756 |
| Daily Pivot Point R1 | 0.6900 |
| Daily Pivot Point R2 | 0.6946 |
| Daily Pivot Point R3 | 0.6973 |
[/s2If]
Join Our Telegram Group
")


