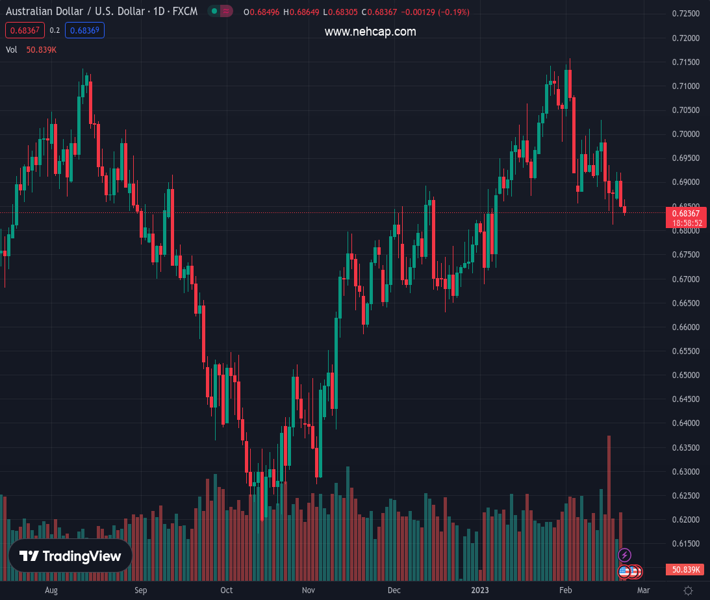
#AUDUSD @ 0.68350 renews intraday low, extends the previous day’s losses as softer Aussie data joins cautious mood. (Pivot Orderbook analysis)
…
This is a premium post.
[s2If !current_user_can(access_s2member_level4)]Please register for PREMIUM VERSION HERE to read full post below containing analysis. In case of any error or you think you are not able to read the full post below, please email us at support#nehcap.com [lwa][/s2If] [s2If current_user_can(access_s2member_level4)]
- AUD/USD renews intraday low, extends the previous day’s losses as softer Aussie data joins cautious mood.
- Australia’s Westpac Leading Index reprints -0.1% for January, Q4 Wage Price Index eased.
- Upbeat US data, firmer yields and hawkish Fed bets escalate anxiety ahead of FOMC Minutes.
The pair currently trades last at 0.68350.
The previous day high was 0.692 while the previous day low was 0.6848. The daily 38.2% Fib levels comes at 0.6875, expected to provide resistance. Similarly, the daily 61.8% fib level is at 0.6892, expected to provide resistance.
AUD/USD drops 0.6835 as it stays on the bear’s radar for the second consecutive day ahead of the all-important Federal Open Market Committee’s (FOMC) Monetary Policy Meeting Minutes early Wednesday. In doing so, the Aussie pair not only portrays the market’s cautious mood but also bears the burden of downbeat data at home, as well as strong US statistics.
That said, Australia’s Westpac Leading Index marked -0.1% figure in January, the second time in a row, whereas the fourth quarter (Q4) Wage Price Index eased to 0.8% QoQ versus 1.0% expected and prior.
On the other hand, the preliminary US S&P Global Manufacturing PMI rose to 47.8 in February from 46.9 prior and versus 47.3 market forecasts while the Services PMI jumped to the eight-month high to 50.5 compared to 47.2 expected and 46.8 previous readings.
The strong data helped the FEDWATCH tool to suggest that the money market participants see the benchmark level peaking at 5.3% in July, and staying near those levels throughout the year, versus 5.10% expected by the US Federal Reserve (Fed).
It should be noted that the AUD/USD pair’s risk barometer status also keeps it weak amid the geopolitical concerns surrounding China and Russia. The comments from US Secretary of State Antony Blinken and Russian President Vladimir Putin were the top catalysts that weigh on the market sentiment as both suggest further tension between Moscow and Kyiv, which also includes indirect participation of the West and China of late.
While portraying the mood, the US 10-year and two-year treasury bond yields seesaw around the three-month highs marked the previous day while S&P 500 Futures print mild gains despite Wall Street’s negative closing.
Moving on, a light calendar ahead of the Fed Minutes can keep the AUD/USD on the bear’s radar and hence further declines toward Friday’s low of 0.6811, also the lowest level in six weeks, can’t be ruled out. However, the Minutes’ signal that the Fed policymakers discussed pivot, may quickly trigger the Aussie pair’s rebound.
A daily closing below 200-day Exponential Moving Average (EMA), around 0.6860 by the press time, directs AUD/USD bears to poke a three-month-old ascending support line, close to 0.6820 at the latest, a break of which becomes necessary for the Aussie sellers to keep the reins.
Technical Levels: Supports and Resistances
AUDUSD currently trading at 0.6839 at the time of writing. Pair opened at 0.6854 and is trading with a change of -0.22% % .
| Overview | Overview.1 | |
|---|---|---|
| 0 | Today last price | 0.6839 |
| 1 | Today Daily Change | -0.0015 |
| 2 | Today Daily Change % | -0.22% |
| 3 | Today daily open | 0.6854 |
The pair is trading below its 20 Daily moving average @ 0.698, below its 50 Daily moving average @ 0.6891 , above its 100 Daily moving average @ 0.6715 and above its 200 Daily moving average @ 0.6805
| Trends | Trends.1 | |
|---|---|---|
| 0 | Daily SMA20 | 0.6980 |
| 1 | Daily SMA50 | 0.6891 |
| 2 | Daily SMA100 | 0.6715 |
| 3 | Daily SMA200 | 0.6805 |
The previous day high was 0.692 while the previous day low was 0.6848. The daily 38.2% Fib levels comes at 0.6875, expected to provide resistance. Similarly, the daily 61.8% fib level is at 0.6892, expected to provide resistance.
Note the levels of interest below:
- Pivot support is noted at 0.6828, 0.6802, 0.6756
- Pivot resistance is noted at 0.69, 0.6946, 0.6973
| Levels | Levels.1 |
|---|---|
| Previous Daily High | 0.6920 |
| Previous Daily Low | 0.6848 |
| Previous Weekly High | 0.7030 |
| Previous Weekly Low | 0.6812 |
| Previous Monthly High | 0.7143 |
| Previous Monthly Low | 0.6688 |
| Daily Fibonacci 38.2% | 0.6875 |
| Daily Fibonacci 61.8% | 0.6892 |
| Daily Pivot Point S1 | 0.6828 |
| Daily Pivot Point S2 | 0.6802 |
| Daily Pivot Point S3 | 0.6756 |
| Daily Pivot Point R1 | 0.6900 |
| Daily Pivot Point R2 | 0.6946 |
| Daily Pivot Point R3 | 0.6973 |
[/s2If]
Join Our Telegram Group
")


