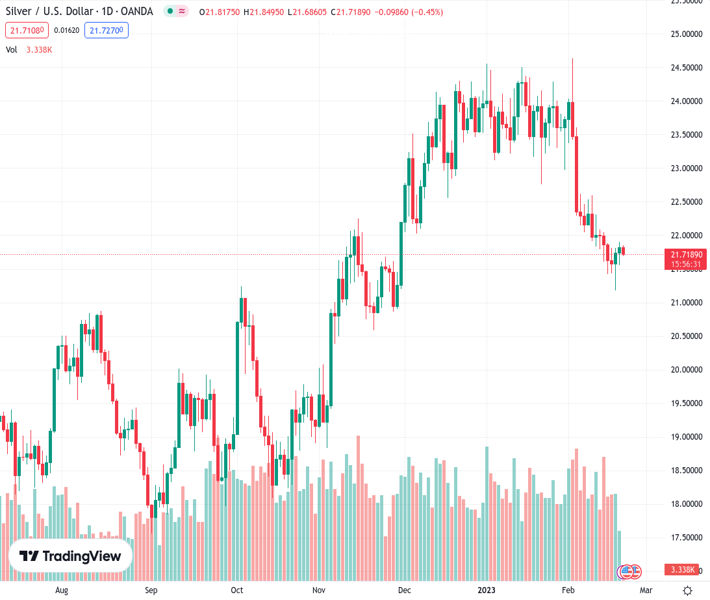
#XAGUSD @ 21.714 Silver price holds lower ground near intraday bottom, snaps two-day winning streak., @nehcap view: Further downside expected (Pivot Orderbook analysis)
…
This is a premium post.
[s2If !current_user_can(access_s2member_level4)]Please register for PREMIUM VERSION HERE to read full post below containing analysis. In case of any error or you think you are not able to read the full post below, please email us at support#nehcap.com [lwa][/s2If] [s2If current_user_can(access_s2member_level4)]
- Silver price holds lower ground near intraday bottom, snaps two-day winning streak.
- U-turn from key moving average, Fibonacci retracement level joins bearish MACD signals to favor XAG/USD bears.
- 61.8% Fibonacci retracement adds to the upside filters, $21.40 acts as immediate support.
The pair currently trades last at 21.714.
The previous day high was 21.91 while the previous day low was 21.55. The daily 38.2% Fib levels comes at 21.77, expected to provide resistance. Similarly, the daily 61.8% fib level is at 21.69, expected to provide support.
Silver price (XAG/USD) remains depressed around $21.70 during the first loss-making day in three heading into Tuesday’s European session. In doing so, the bright metal portrays a clear reversal from the 200-Hour Moving Average (HMA), as well as the 50% Fibonacci retracement level of its moves between February 09 and 17.
Not only the U-turn from the key technical hurdles but the bearish MACD signals also keep XAG/USD sellers hopeful.
With this, the precious metal’s further declines toward one-week-old horizontal support near $21.40 appear imminent.
However, the monthly low near $21.20 and the 61.8% Fibonacci Expansion (FE) of the metal’s moves from February 09 to 20, around the $21.00 threshold, could challenge the Silver bears.
In a case where the metal remains bearish past $21.00, the odds of witnessing a slump toward the $20.00 psychological magnet can’t be ruled out.
Alternatively, the 200-HMA and the 50% Fibonacci retracement level, respectively close to $21.85 and $21.90, restrict short-term recovery of the XAG/USD.
Following that, the $22.00 round figure will precede the 61.8% Fibonacci retracement level, also known as the gold Fibonacci ratio, could challenge the Silver buyers around $22.05.
Should the XAG/USD remains firmer past $22.05, the February 10 swing high near $22.30 could act as the last defense of the bears.
Trend: Further downside expected
Technical Levels: Supports and Resistances
XAGUSD currently trading at 21.72 at the time of writing. Pair opened at 21.82 and is trading with a change of -0.46% % .
| Overview | Overview.1 | |
|---|---|---|
| 0 | Today last price | 21.72 |
| 1 | Today Daily Change | -0.10 |
| 2 | Today Daily Change % | -0.46% |
| 3 | Today daily open | 21.82 |
The pair is trading below its 20 Daily moving average @ 22.68, below its 50 Daily moving average @ 23.31 , below its 100 Daily moving average @ 21.99 and above its 200 Daily moving average @ 21.02
| Trends | Trends.1 | |
|---|---|---|
| 0 | Daily SMA20 | 22.68 |
| 1 | Daily SMA50 | 23.31 |
| 2 | Daily SMA100 | 21.99 |
| 3 | Daily SMA200 | 21.02 |
The previous day high was 21.91 while the previous day low was 21.55. The daily 38.2% Fib levels comes at 21.77, expected to provide resistance. Similarly, the daily 61.8% fib level is at 21.69, expected to provide support.
Note the levels of interest below:
- Pivot support is noted at 21.61, 21.4, 21.26
- Pivot resistance is noted at 21.97, 22.12, 22.33
| Levels | Levels.1 |
|---|---|
| Previous Daily High | 21.91 |
| Previous Daily Low | 21.55 |
| Previous Weekly High | 22.08 |
| Previous Weekly Low | 21.18 |
| Previous Monthly High | 24.55 |
| Previous Monthly Low | 22.76 |
| Daily Fibonacci 38.2% | 21.77 |
| Daily Fibonacci 61.8% | 21.69 |
| Daily Pivot Point S1 | 21.61 |
| Daily Pivot Point S2 | 21.40 |
| Daily Pivot Point S3 | 21.26 |
| Daily Pivot Point R1 | 21.97 |
| Daily Pivot Point R2 | 22.12 |
| Daily Pivot Point R3 | 22.33 |
[/s2If]
Join Our Telegram Group
")


