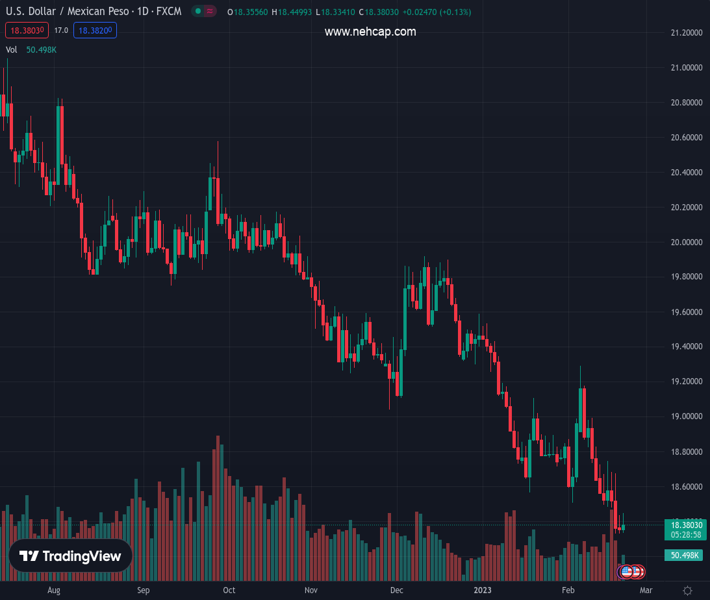
#USDMXN @ 18.3885 cannot drop to fresh YTD lows after hitting 18.3301 on February 17. (Pivot Orderbook analysis)
…
This is a premium post.
[s2If !current_user_can(access_s2member_level4)]Please register for PREMIUM VERSION HERE to read full post below containing analysis. In case of any error or you think you are not able to read the full post below, please email us at support#nehcap.com [lwa][/s2If] [s2If current_user_can(access_s2member_level4)]
- USD/MXN cannot drop to fresh YTD lows after hitting 18.3301 on February 17.
- Positive divergence between the RSI and USD/MXN price action suggests further upside is warranted.
- USD/MXN: If it reclaims 18.45, it could test $18.70; otherwise, the YTD lows are targeted.
The pair currently trades last at 18.3885.
The previous day high was 18.4376 while the previous day low was 18.3318. The daily 38.2% Fib levels comes at 18.3972, expected to provide resistance. Similarly, the daily 61.8% fib level is at 18.3722, expected to provide support.
The Mexican Peso (MXN) weakens vs. the US Dollar (USD) as Wall Street’s session begins, yet stills exchanging hands below Monday’s high of 18.4366, which would further warrant downward action. However, the USD/MXN is registering decent gains of 0.23%, trading at 18.3977.
From a daily chart perspective, the USD/MXN remains downward biased. In the last three days, USD/MXN sellers had been unable to drag prices towards the $18.00 psychological barrier, beneath the YTD low of 18.3301.
Momentum indicators like the Relative Strength Index (RSI), albeit in bearish territory, suggest that buying pressure could be building. The Rate of Change (RoC) hit the neutral level after three-straight days of equal to no volatility.
The USD/MXN needs to conquer Monday’s high for an upward reversal. Once cleared, the USD/MXN might rally toward the confluence of February 16 and 17 daily highs and the 20-day EMA at the 18.66/68 area. A decisive break will expose the 50-day EMA at 18.9428, ahead of the psychological $19.00 area.
For a bearish continuation of the USD/MXN, sellers must challenge the $18.00 figure once they cleared the YTD low at 18.3301. If the USD/MXN reclaims 18.0000, the next support would be April 17, 2018, swing low at 17.9388, followed by July 19, 2017, daily low of 17.4498.
Technical Levels: Supports and Resistances
USDMXN currently trading at 18.3974 at the time of writing. Pair opened at 18.3856 and is trading with a change of 0.06 % .
| Overview | Overview.1 | |
|---|---|---|
| 0 | Today last price | 18.3974 |
| 1 | Today Daily Change | 0.0118 |
| 2 | Today Daily Change % | 0.0600 |
| 3 | Today daily open | 18.3856 |
The pair remains strongly bearish on the daily time frame. It trades below the 20 SMA @ 18.7181, 50 SMA 19.06, 100 SMA @ 19.3731 and 200 SMA @ 19.7525.
| Trends | Trends.1 | |
|---|---|---|
| 0 | Daily SMA20 | 18.7181 |
| 1 | Daily SMA50 | 19.0600 |
| 2 | Daily SMA100 | 19.3731 |
| 3 | Daily SMA200 | 19.7525 |
The previous day high was 18.4376 while the previous day low was 18.3318. The daily 38.2% Fib levels comes at 18.3972, expected to provide resistance. Similarly, the daily 61.8% fib level is at 18.3722, expected to provide support.
Note the levels of interest below:
- Pivot support is noted at 18.3324, 18.2792, 18.2266
- Pivot resistance is noted at 18.4382, 18.4908, 18.544
| Levels | Levels.1 |
|---|---|
| Previous Daily High | 18.4376 |
| Previous Daily Low | 18.3318 |
| Previous Weekly High | 18.7540 |
| Previous Weekly Low | 18.3306 |
| Previous Monthly High | 19.5361 |
| Previous Monthly Low | 18.5663 |
| Daily Fibonacci 38.2% | 18.3972 |
| Daily Fibonacci 61.8% | 18.3722 |
| Daily Pivot Point S1 | 18.3324 |
| Daily Pivot Point S2 | 18.2792 |
| Daily Pivot Point S3 | 18.2266 |
| Daily Pivot Point R1 | 18.4382 |
| Daily Pivot Point R2 | 18.4908 |
| Daily Pivot Point R3 | 18.5440 |
[/s2If]
Join Our Telegram Group
")


