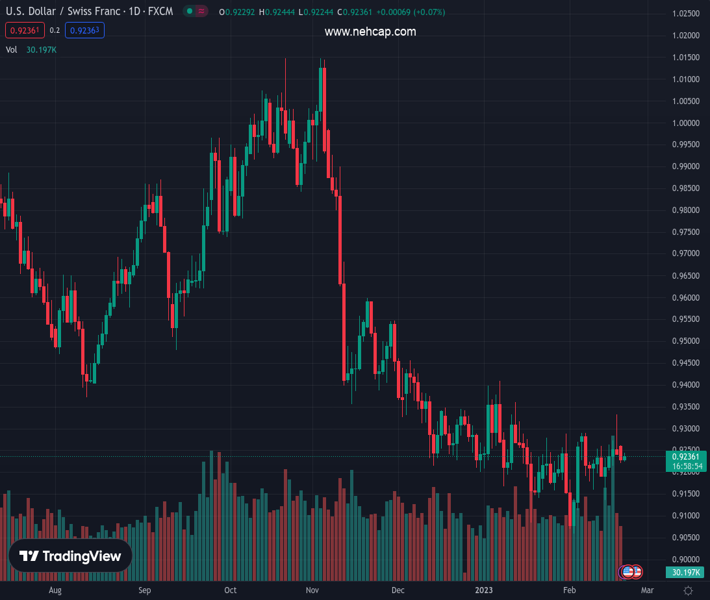
#USDCHF @ 0.92361 grinds near intraday high during the first positive day in three. (Pivot Orderbook analysis)
…
This is a premium post.
[s2If !current_user_can(access_s2member_level4)]Please register for PREMIUM VERSION HERE to read full post below containing analysis. In case of any error or you think you are not able to read the full post below, please email us at support#nehcap.com [lwa][/s2If] [s2If current_user_can(access_s2member_level4)]
- USD/CHF grinds near intraday high during the first positive day in three.
- Risk aversion joins firmer yields to underpin US Dollar rebound amid full markets.
- Geopolitical concerns surrounding China, North Korea and Russia weigh on sentiment.
- Swiss trade numbers, US PMI eyed for immediate directions, Fed Minutes is the key.
The pair currently trades last at 0.92361.
The previous day high was 0.9265 while the previous day low was 0.9221. The daily 38.2% Fib levels comes at 0.9238, expected to provide resistance. Similarly, the daily 61.8% fib level is at 0.9248, expected to provide resistance.
USD/CHF remains mildly bid around 0.9240, despite recently easing from the intraday high, as the Swiss pair (CHF) traders benefit from the US Dollar rebound amid sour sentiment.
It’s worth noting, however, that the cautious mood ahead of the key data/events favors the USD/CHF buyers.
That said, the US Dollar Index (DXY) snaps a two-day losing streak while marking mild gains near 104.00. In doing so, the greenback’s gauge versus the six major currencies traces the US Treasury bond yields, as well as benefits from the traditional haven status. That said, the US 10-year Treasury bond yields pick up bids to near the highest levels marked since early November 2022, mildly bid around 3.86% at the latest. While portraying the mood, S&P 500 Futures declined 0.40% intraday to 4,070 at the latest.
While tracing the run-up in the US Treasury bond yields, the fears emanating from China, North Korea and Russia seemed to have underpinned the fresh run-up in the US Treasury bond yields, amid hawkish hopes from the US Federal Reserve (Fed), as well as the US Dollar rebound. That said, the US and China alleged each other over the balloon shooting whereas the US diplomatic ties with Taiwan teased Beijing on Monday. On the same line, the United Nations (UN) Security Council is alarmed by Japan for North Korea’s missile testing and could help the US Dollar to remain firmer due to its safe-haven status.
At home, the Swiss National Bank’s (SNB) previous warnings to use open market operations to defend the CHF seemed to have weighed on the USD/CHF prices. However, the cautious mood ahead of today’s Swiss trade numbers for January and the preliminary readings of the US Purchasing Managers Index (PMI) data for February will be important for the US Dollar ahead of Wednesday’s Federal Open Market Committee’s (FOMC) Monetary Policy Meeting Minutes.
Overall, USD/CHF is likely to remain directed towards the north unless the US PMIs disappoint the watchers.
Given the USD/CHF pair’s rebound from the previous resistance line from late November, close to 0.9225 at the latest, the buyers are likely approaching the weekly top of 0.9332. However, the 50-DMA restricts the immediate upside of the quote near 0.9245.
Technical Levels: Supports and Resistances
USDCHF currently trading at 0.9241 at the time of writing. Pair opened at 0.9232 and is trading with a change of 0.10% % .
| Overview | Overview.1 | |
|---|---|---|
| 0 | Today last price | 0.9241 |
| 1 | Today Daily Change | 0.0009 |
| 2 | Today Daily Change % | 0.10% |
| 3 | Today daily open | 0.9232 |
The pair is trading above its 20 Daily moving average @ 0.9213, below its 50 Daily moving average @ 0.9248 , below its 100 Daily moving average @ 0.9487 and below its 200 Daily moving average @ 0.9582
| Trends | Trends.1 | |
|---|---|---|
| 0 | Daily SMA20 | 0.9213 |
| 1 | Daily SMA50 | 0.9248 |
| 2 | Daily SMA100 | 0.9487 |
| 3 | Daily SMA200 | 0.9582 |
The previous day high was 0.9265 while the previous day low was 0.9221. The daily 38.2% Fib levels comes at 0.9238, expected to provide resistance. Similarly, the daily 61.8% fib level is at 0.9248, expected to provide resistance.
Note the levels of interest below:
- Pivot support is noted at 0.9213, 0.9195, 0.9169
- Pivot resistance is noted at 0.9258, 0.9284, 0.9302
| Levels | Levels.1 |
|---|---|
| Previous Daily High | 0.9265 |
| Previous Daily Low | 0.9221 |
| Previous Weekly High | 0.9332 |
| Previous Weekly Low | 0.9138 |
| Previous Monthly High | 0.9410 |
| Previous Monthly Low | 0.9085 |
| Daily Fibonacci 38.2% | 0.9238 |
| Daily Fibonacci 61.8% | 0.9248 |
| Daily Pivot Point S1 | 0.9213 |
| Daily Pivot Point S2 | 0.9195 |
| Daily Pivot Point S3 | 0.9169 |
| Daily Pivot Point R1 | 0.9258 |
| Daily Pivot Point R2 | 0.9284 |
| Daily Pivot Point R3 | 0.9302 |
[/s2If]
Join Our Telegram Group
")


