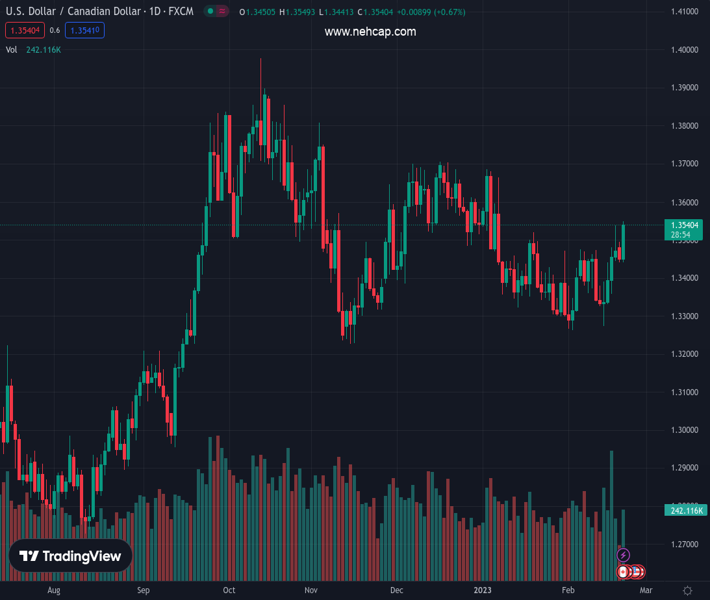
#USDCAD @ 1.35406 reclaims 1.3500, distancing from the daily EMAs, as the uptrend accelerates. (Pivot Orderbook analysis)
…
This is a premium post.
[s2If !current_user_can(access_s2member_level4)]Please register for PREMIUM VERSION HERE to read full post below containing analysis. In case of any error or you think you are not able to read the full post below, please email us at support#nehcap.com [lwa][/s2If] [s2If current_user_can(access_s2member_level4)]
- USD/CAD reclaims 1.3500, distancing from the daily EMAs, as the uptrend accelerates.
- The major is testing a downslope trendline, which, if broken, the USD/CAD can rally to 1.3700.
The pair currently trades last at 1.35406.
The previous day high was 1.3495 while the previous day low was 1.3441. The daily 38.2% Fib levels comes at 1.3462, expected to provide support. Similarly, the daily 61.8% fib level is at 1.3474, expected to provide support.
The USD/CAD advanced in the North American session, though it retraced from 7-week highs at 1.3549, it retreated late in the session. Nevertheless, the USD/CAD is trading at 1.3537 and is gaining 0.65%.
After bottoming around 1.3262, the USD/CAD pair is gaining traction, and it’s approaching a four-month-old downslope resistance area at around 1.3560-75. Albeit, the major cleared significant hurdles on its way north, namely the 20, 50, 100, and 200-day Exponential Moving Averages (EMAs), consolidated within a 200-pip range. Nonetheless, the USD/CAD reclaiming the 1.3500 figure exacerbated the rally to multi-week highs.
For an uptrend resumption, the USD/CAD needs to break a downslope resistance trendline at around 1.3560-75. Once broken, the USD/CAD might test the 1.3600 psychological level. A breach of the latter, the USD/CAD will rally toward the January 3 daily high at 1.3685, followed by 1.3700.
As an alternate scenario, the USD/CAD first support would be 1.3500. Once cleared, the path toward the 50-day EMA at 1.3436 would be clear. The following demand area to be tested by the USD/CAD would be the confluence of the 20 and 100-day EMAs, at 1.3418 and 1.3413, respectively.
Technical Levels: Supports and Resistances
USDCAD currently trading at 1.3537 at the time of writing. Pair opened at 1.3453 and is trading with a change of 0.62 % .
| Overview | Overview.1 | |
|---|---|---|
| 0 | Today last price | 1.3537 |
| 1 | Today Daily Change | 0.0084 |
| 2 | Today Daily Change % | 0.6200 |
| 3 | Today daily open | 1.3453 |
The pair remains strongly bullish on the daily timeframe. It trades above its 20 SMA @ 1.3382, 50 SMA 1.3466, 100 SMA @ 1.3516 and 200 SMA @ 1.3249.
| Trends | Trends.1 | |
|---|---|---|
| 0 | Daily SMA20 | 1.3382 |
| 1 | Daily SMA50 | 1.3466 |
| 2 | Daily SMA100 | 1.3516 |
| 3 | Daily SMA200 | 1.3249 |
The previous day high was 1.3495 while the previous day low was 1.3441. The daily 38.2% Fib levels comes at 1.3462, expected to provide support. Similarly, the daily 61.8% fib level is at 1.3474, expected to provide support.
Note the levels of interest below:
- Pivot support is noted at 1.3431, 1.341, 1.3378
- Pivot resistance is noted at 1.3485, 1.3516, 1.3538
| Levels | Levels.1 |
|---|---|
| Previous Daily High | 1.3495 |
| Previous Daily Low | 1.3441 |
| Previous Weekly High | 1.3538 |
| Previous Weekly Low | 1.3274 |
| Previous Monthly High | 1.3685 |
| Previous Monthly Low | 1.3300 |
| Daily Fibonacci 38.2% | 1.3462 |
| Daily Fibonacci 61.8% | 1.3474 |
| Daily Pivot Point S1 | 1.3431 |
| Daily Pivot Point S2 | 1.3410 |
| Daily Pivot Point S3 | 1.3378 |
| Daily Pivot Point R1 | 1.3485 |
| Daily Pivot Point R2 | 1.3516 |
| Daily Pivot Point R3 | 1.3538 |
[/s2If]
Join Our Telegram Group
")


