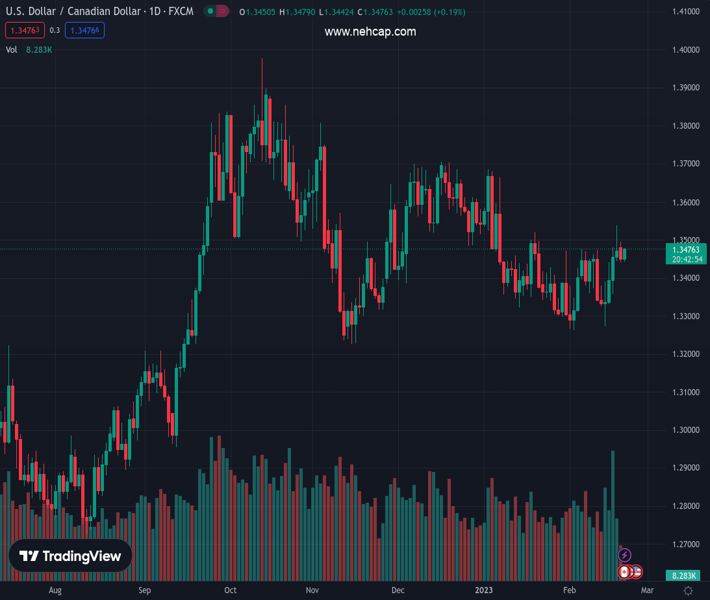
#USDCAD @ 1.34762 remains sidelined after breaking one-week-old ascending trend line the previous day., @nehcap view: Further downside expected (Pivot Orderbook analysis)
…
This is a premium post.
[s2If !current_user_can(access_s2member_level4)]Please register for PREMIUM VERSION HERE to read full post below containing analysis. In case of any error or you think you are not able to read the full post below, please email us at support#nehcap.com [lwa][/s2If] [s2If current_user_can(access_s2member_level4)]
- USD/CAD remains sidelined after breaking one-week-old ascending trend line the previous day.
- Bearish MACD signals add strength to the downside bias targeting 200-SMA.
- Bulls need successful break of 61.8% golden Fibonacci ratio to retake control.
The pair currently trades last at 1.34762.
The previous day high was 1.3495 while the previous day low was 1.3441. The daily 38.2% Fib levels comes at 1.3462, expected to provide support. Similarly, the daily 61.8% fib level is at 1.3474, expected to provide support.
USD/CAD struggles for clear directions, despite picking up bids to refreshi ntraday high around 1.3470 during Tuesday’s Asian session, following a downbeat start of the week.
Although holidays in the US and Canada restricted the Loonie pair’s previous moves, the quote’s sustained trading below the previous support line from the last Tuesday, now resistance near 1.3490, keeps the pair sellers hopeful.
Also adding strength to the downside bias are the bearish MACD signals and a clear U-turn from the 61.8% Fibonacci retracement level of the pair’s December 2022 to February 2023 downside, near 1.3540 at the latest.
That said, the USD/CAD bears may aim for the 200-Simple Moving Average (SMA), close to 1.3400 by the press time, as an immediate target during the quote’s fresh downside past the latest low of 1.3440. Following that, the monthly bottom surrounding 1.3260 will be in focus.
Alternatively, the aforementioned support-turned-resistance line and the 61.8% Fibonacci retracement level could challenge the short-term USD/CAD buyers around 1.3490 and 1.3540 respectively.
In a case where the Loonie pair remains firmer past 1.3540, January’s peak surrounding 1.3685 and multiple hurdles marked during late 2022 around 1.3700 will be in the focus of the pair buyers.
To sum up, USD/CAD remains on the bear’s radar despite the latest corrective bounce.
Trend: Further downside expected
Technical Levels: Supports and Resistances
USDCAD currently trading at 1.3463 at the time of writing. Pair opened at 1.3453 and is trading with a change of 0.07% % .
| Overview | Overview.1 | |
|---|---|---|
| 0 | Today last price | 1.3463 |
| 1 | Today Daily Change | 0.0010 |
| 2 | Today Daily Change % | 0.07% |
| 3 | Today daily open | 1.3453 |
The pair is trading above its 20 Daily moving average @ 1.3382, below its 50 Daily moving average @ 1.3466 , below its 100 Daily moving average @ 1.3516 and above its 200 Daily moving average @ 1.3249
| Trends | Trends.1 | |
|---|---|---|
| 0 | Daily SMA20 | 1.3382 |
| 1 | Daily SMA50 | 1.3466 |
| 2 | Daily SMA100 | 1.3516 |
| 3 | Daily SMA200 | 1.3249 |
The previous day high was 1.3495 while the previous day low was 1.3441. The daily 38.2% Fib levels comes at 1.3462, expected to provide support. Similarly, the daily 61.8% fib level is at 1.3474, expected to provide support.
Note the levels of interest below:
- Pivot support is noted at 1.3431, 1.341, 1.3378
- Pivot resistance is noted at 1.3485, 1.3516, 1.3538
| Levels | Levels.1 |
|---|---|
| Previous Daily High | 1.3495 |
| Previous Daily Low | 1.3441 |
| Previous Weekly High | 1.3538 |
| Previous Weekly Low | 1.3274 |
| Previous Monthly High | 1.3685 |
| Previous Monthly Low | 1.3300 |
| Daily Fibonacci 38.2% | 1.3462 |
| Daily Fibonacci 61.8% | 1.3474 |
| Daily Pivot Point S1 | 1.3431 |
| Daily Pivot Point S2 | 1.3410 |
| Daily Pivot Point S3 | 1.3378 |
| Daily Pivot Point R1 | 1.3485 |
| Daily Pivot Point R2 | 1.3516 |
| Daily Pivot Point R3 | 1.3538 |
[/s2If]
Join Our Telegram Group
")


