The index reverses two consecutive daily pullbacks on Tuesday. (Pivot Orderbook analysis)
…
This is a premium post.
[s2If !current_user_can(access_s2member_level4)]Please register for PREMIUM VERSION HERE to read full post below containing analysis. In case of any error or you think you are not able to read the full post below, please email us at support#nehcap.com [lwa][/s2If] [s2If current_user_can(access_s2member_level4)]
- The index reverses two consecutive daily pullbacks on Tuesday.
- Further rebound could see the monthly high near 104.70 revisited.
The pair currently trades last at 104.08.
The previous day high was 104.09 while the previous day low was 103.76. The daily 38.2% Fib levels comes at 103.88, expected to provide support. Similarly, the daily 61.8% fib level is at 103.96, expected to provide support.
DXY picks up pace and advances to 2-day highs past the 104.00 hurdle on turnaround Tuesday.
The ongoing price action favours some consolidation in the upper end of the range. Immediately to the upside now comes the February top at 104.66 (February 17), while the surpass of this level exposes a probable move to the 2023 high at 105.63 (January 6) in the not-so-distant future.
In the longer run, while below the 200-day SMA at 106.44, the outlook for the index remains negative.
Technical Levels: Supports and Resistances
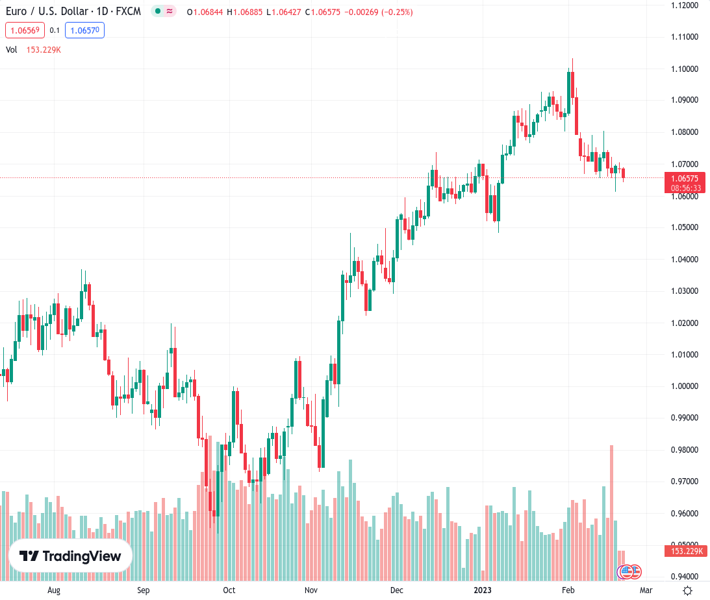
EURUSD currently trading at 104.08 at the time of writing. Pair opened at 103.88 and is trading with a change of 0.19 % .
| Overview | Overview.1 | |
|---|---|---|
| 0 | Today last price | 104.08 |
| 1 | Today Daily Change | 39.00 |
| 2 | Today Daily Change % | 0.19 |
| 3 | Today daily open | 103.88 |
The pair is trading above its 20 Daily moving average @ 102.85, above its 50 Daily moving average @ 103.3 , below its 100 Daily moving average @ 105.53 and below its 200 Daily moving average @ 106.78
| Trends | Trends.1 | |
|---|---|---|
| 0 | Daily SMA20 | 102.85 |
| 1 | Daily SMA50 | 103.30 |
| 2 | Daily SMA100 | 105.53 |
| 3 | Daily SMA200 | 106.78 |
The previous day high was 104.09 while the previous day low was 103.76. The daily 38.2% Fib levels comes at 103.88, expected to provide support. Similarly, the daily 61.8% fib level is at 103.96, expected to provide support.
Note the levels of interest below:
- Pivot support is noted at 103.73, 103.57, 103.39
- Pivot resistance is noted at 104.06, 104.24, 104.39
| Levels | Levels.1 |
|---|---|
| Previous Daily High | 104.09 |
| Previous Daily Low | 103.76 |
| Previous Weekly High | 104.68 |
| Previous Weekly Low | 102.54 |
| Previous Monthly High | 105.63 |
| Previous Monthly Low | 101.50 |
| Daily Fibonacci 38.2% | 103.88 |
| Daily Fibonacci 61.8% | 103.96 |
| Daily Pivot Point S1 | 103.73 |
| Daily Pivot Point S2 | 103.57 |
| Daily Pivot Point S3 | 103.39 |
| Daily Pivot Point R1 | 104.06 |
| Daily Pivot Point R2 | 104.24 |
| Daily Pivot Point R3 | 104.39 |
[/s2If]
Join Our Telegram Group
")


