Speculations for further tightening by the Federal Reserve underpin the US Dollar, a headwind for oil prices. (Pivot Orderbook analysis)
…
This is a premium post.
[s2If !current_user_can(access_s2member_level4)]Please register for PREMIUM VERSION HERE to read full post below containing analysis. In case of any error or you think you are not able to read the full post below, please email us at support#nehcap.com [lwa][/s2If] [s2If current_user_can(access_s2member_level4)]
- Speculations for further tightening by the Federal Reserve underpin the US Dollar, a headwind for oil prices.
- China’s reopening and Russia expected to cut its oil production capped WTI’s fall.
- WTI Technical analysis: Neutral to downward biased; once it breaks $75.00, a retest of monthly lows is likely.
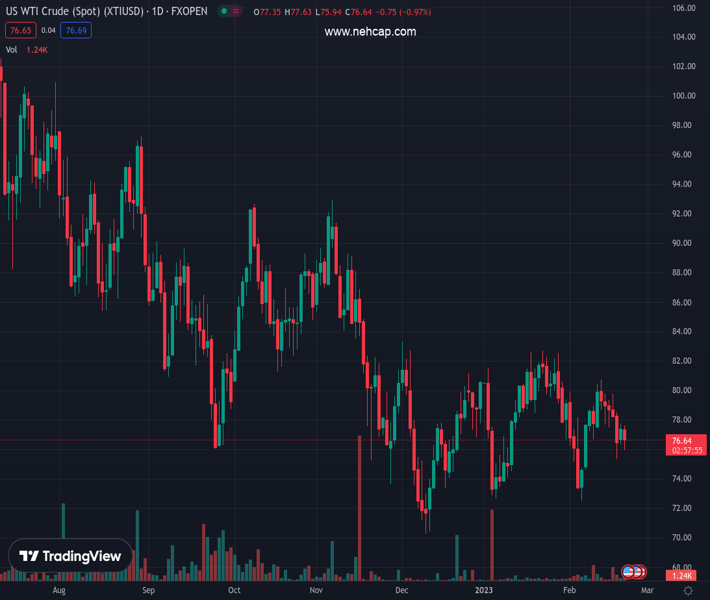
The pair currently trades last at 76.64.
The previous day high was 77.75 while the previous day low was 76.33. The daily 38.2% Fib levels comes at 77.21, expected to provide resistance. Similarly, the daily 61.8% fib level is at 76.88, expected to provide resistance.
Western Texas Intermediate (WTI), the US crude oil benchmark, is erasing Monday’s gains which fell shy of reaching the 20-day Exponential Moving Average (EMA), and dropped towards the lows of the week around 75.97 before settling around the current price. At the time of typing, WTI is losing 0.94%, trading at 76.64 per barrel.
The strong US Dollar (USD) narrative is hitting the commodities market. During the last week, Federal Reserve (Fed) officials continued their hawkish rhetoric while data supported some of their comments. Traders should remember that although Cleveland and St. Louis Fed Presidents Loretta Mester and James Bullard do not vote in the FOMC, both supported raising rates by 50 bps.
That spurred speculations that the US Federal Reserve (Fed) might hike rates not twice but three times, which could lift the Federal Funds Rate (FFR) to the 5.25%-5.50% mark.
Meanwhile, the US Dollar Index (DXY), which tracks the buck’s value vs. a basket of six currencies, advances 0.29%, up at 104.184, a headwind for dollar-denominated assets. Therefore, a strong USD makes oil prices expensive for foreign countries.
Aside from this, China’s reopening is a factor playing into WTI’s price, and capped oil prices fall in Tuesday’s session. Russia’s announced that it plans to cut production by 500,000 bpd or about 5% of its output in March as retaliation to the West imposing price caps on Russian oil and oil-related products.
Data-wise, US oil inventories and data, which were to be released on Tuesday, was postponed in observance of President’s Day and moved to Wednesday and Thursday.
From a technical perspective, WTI is still neutral to downward biased, capped by all the Exponential Moving Averages (EMAs) resting above oil’s price. In addition, the Relative Strength Index (RSI) is in bearish territory and is aiming downwards. The Rate of Change (RoC), albeit steadily, shows that sellers continue gaining momentum.
Hence, WTI’s first support would be $75.97. Once cleared, the oil price would tumble to the last week’s low at $75.36, followed by the MTD low at $72.30.
Technical Levels: Supports and Resistances
XTIUSD currently trading at 76.64 at the time of writing. Pair opened at 77.41 and is trading with a change of -0.99 % .
| Overview | Overview.1 | |
|---|---|---|
| 0 | Today last price | 76.64 |
| 1 | Today Daily Change | -0.77 |
| 2 | Today Daily Change % | -0.99 |
| 3 | Today daily open | 77.41 |
The pair remains strongly bearish on the daily time frame. It trades below the 20 SMA @ 78.18, 50 SMA 78.05, 100 SMA @ 80.77 and 200 SMA @ 89.27.
| Trends | Trends.1 | |
|---|---|---|
| 0 | Daily SMA20 | 78.18 |
| 1 | Daily SMA50 | 78.05 |
| 2 | Daily SMA100 | 80.77 |
| 3 | Daily SMA200 | 89.27 |
The previous day high was 77.75 while the previous day low was 76.33. The daily 38.2% Fib levels comes at 77.21, expected to provide resistance. Similarly, the daily 61.8% fib level is at 76.88, expected to provide resistance.
Note the levels of interest below:
- Pivot support is noted at 76.58, 75.75, 75.16
- Pivot resistance is noted at 78.0, 78.59, 79.42
| Levels | Levels.1 |
|---|---|
| Previous Daily High | 77.75 |
| Previous Daily Low | 76.33 |
| Previous Weekly High | 80.75 |
| Previous Weekly Low | 75.34 |
| Previous Monthly High | 82.68 |
| Previous Monthly Low | 72.64 |
| Daily Fibonacci 38.2% | 77.21 |
| Daily Fibonacci 61.8% | 76.88 |
| Daily Pivot Point S1 | 76.58 |
| Daily Pivot Point S2 | 75.75 |
| Daily Pivot Point S3 | 75.16 |
| Daily Pivot Point R1 | 78.00 |
| Daily Pivot Point R2 | 78.59 |
| Daily Pivot Point R3 | 79.42 |
[/s2If]
Join Our Telegram Group
")


