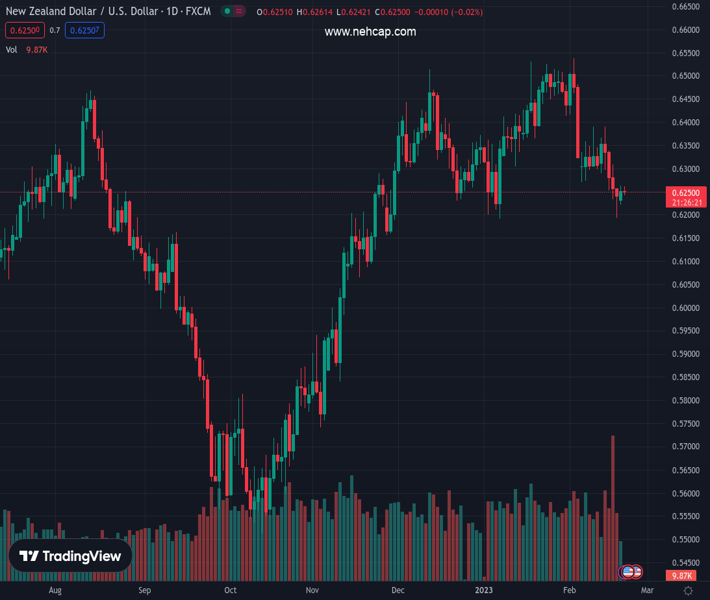
#NZDUSD @ 0.62506 is juggling ahead of the interest rate decision by the RBNZ. (Pivot Orderbook analysis)
…
This is a premium post.
[s2If !current_user_can(access_s2member_level4)]Please register for PREMIUM VERSION HERE to read full post below containing analysis. In case of any error or you think you are not able to read the full post below, please email us at support#nehcap.com [lwa][/s2If] [s2If current_user_can(access_s2member_level4)]
- NZD/USD is juggling ahead of the interest rate decision by the RBNZ.
- The Kiwi asset has sensed a decent buying interest after testing the horizontal support plotted from 0.6200.
- RBNZ’s Shadow Board recommended a 50bps OCR increase citing strong inflationary pressures.
The pair currently trades last at 0.62506.
The previous day high was 0.6263 while the previous day low was 0.6221. The daily 38.2% Fib levels comes at 0.6247, expected to provide support. Similarly, the daily 61.8% fib level is at 0.6237, expected to provide support.
The NZD/USD pair is juggling below the immediate resistance of 0.6260 as investors are awaiting the interest rate decision from the Reserve Bank OF New Zealand (RBNZ) for further impetus. The New Zealand Consumer Price Index (CPI) has not delivered any sign, which could convey that inflationary pressures are peaked now. Therefore, a continuation of an interest rate hike is expected from RBNZ Governor Adrian Orr.
Meanwhile, a promise of a cyclone relief package of NZ$300 million ($187.08 million) by NZ Prime Minister (PM) Chris Hipkins has triggered fresh concerns about an increment in inflation projections. The release of the helicopter money might propel overall consumer spending and eventually the price pressures. On Monday, RBNZ’s Shadow Board recommended a 50bps OCR increase citing strong inflationary pressures.
The US Dollar Index (DXY) is auctioning above 103.50, however, higher volatility cannot be ruled out as United States markets will open after a holiday-truncated weekend.
NZD/USD has sensed a decent buying interest after testing the horizontal support plotted from January 3 low around 0.6200 on a four-hour scale. This indicates a Double Bottom chart formation that results in a bullish reversal. The Kiwi asset is deploying efforts in surpassing the 20-period Exponential Moving Average (EMA) at 0.6258.
Meanwhile, the Relative Strength Index (RSI) (14) has managed to avoid the bearish range of 20.00-40.00. The RSI (14) has climbed back inside the 40.00-60.00 range and is awaiting a fresh trigger for a decisive move.
For further upside, the Kiwi asset needs to surpass January 8 low at 0.6272, which will drive the asset towards January 9 low at 0.6320, followed by February 7 high at 0.6363.
Alternatively, a breakdown of January 6 low at 0.6193 will drag the asset toward November 28 low at 0.6155. A slippage below the latter will expose the asset for more downside toward the round-level support at 0.6100.
Technical Levels: Supports and Resistances
NZDUSD currently trading at 0.6247 at the time of writing. Pair opened at 0.6253 and is trading with a change of -0.1 % .
| Overview | Overview.1 | |
|---|---|---|
| 0 | Today last price | 0.6247 |
| 1 | Today Daily Change | -0.0006 |
| 2 | Today Daily Change % | -0.1000 |
| 3 | Today daily open | 0.6253 |
The pair is trading below its 20 Daily moving average @ 0.6375, below its 50 Daily moving average @ 0.6364 , above its 100 Daily moving average @ 0.6165 and above its 200 Daily moving average @ 0.6187
| Trends | Trends.1 | |
|---|---|---|
| 0 | Daily SMA20 | 0.6375 |
| 1 | Daily SMA50 | 0.6364 |
| 2 | Daily SMA100 | 0.6165 |
| 3 | Daily SMA200 | 0.6187 |
The previous day high was 0.6263 while the previous day low was 0.6221. The daily 38.2% Fib levels comes at 0.6247, expected to provide support. Similarly, the daily 61.8% fib level is at 0.6237, expected to provide support.
Note the levels of interest below:
- Pivot support is noted at 0.6229, 0.6204, 0.6187
- Pivot resistance is noted at 0.6271, 0.6288, 0.6313
| Levels | Levels.1 |
|---|---|
| Previous Daily High | 0.6263 |
| Previous Daily Low | 0.6221 |
| Previous Weekly High | 0.6391 |
| Previous Weekly Low | 0.6193 |
| Previous Monthly High | 0.6531 |
| Previous Monthly Low | 0.6190 |
| Daily Fibonacci 38.2% | 0.6247 |
| Daily Fibonacci 61.8% | 0.6237 |
| Daily Pivot Point S1 | 0.6229 |
| Daily Pivot Point S2 | 0.6204 |
| Daily Pivot Point S3 | 0.6187 |
| Daily Pivot Point R1 | 0.6271 |
| Daily Pivot Point R2 | 0.6288 |
| Daily Pivot Point R3 | 0.6313 |
[/s2If]
Join Our Telegram Group
")


