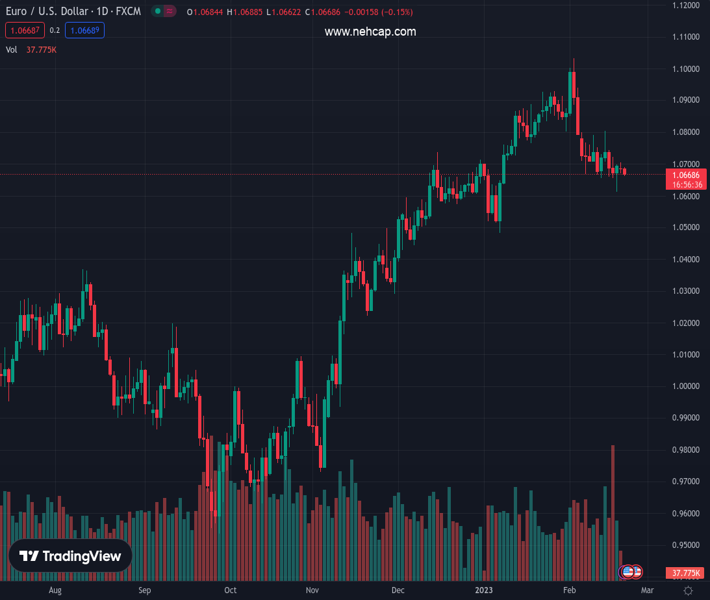
#EURUSD @ 1.06681 has slipped firmly to near 1.0660 as the USD Index eyes more upside. (Pivot Orderbook analysis)
…
This is a premium post.
[s2If !current_user_can(access_s2member_level4)]Please register for PREMIUM VERSION HERE to read full post below containing analysis. In case of any error or you think you are not able to read the full post below, please email us at support#nehcap.com [lwa][/s2If] [s2If current_user_can(access_s2member_level4)]
- EUR/USD has slipped firmly to near 1.0660 as the USD Index eyes more upside.
- S&P500 futures are showing losses ahead of the US opening after an elongated weekend.
- The majority of institutional investors are having pessimist view for Eurozone economic projections.
The pair currently trades last at 1.06681.
The previous day high was 1.0705 while the previous day low was 1.067. The daily 38.2% Fib levels comes at 1.0683, expected to provide resistance. Similarly, the daily 61.8% fib level is at 1.0692, expected to provide resistance.
The EUR/USD pair has slipped to near 1.0660 in the Asian session as the risk appetite of the market participants has trimmed ahead of the global PMI figures. Investors are worried that higher interest rates by the majority of central banks in taming the stubborn inflation have impacted the scale of economic activities. Firms have no other option than to tap funding on higher borrowing costs. Therefore, producers are dodging borrowing or limiting them to fulfill the essential requirements.
The major currency pair has witnessed a steep fall after surrendering the 1.0670 cushion and is expected to display more weakness ahead as the US Dollar Index (DXY) has rebounded firmly. The USD Index is shifting its auction profile above 103.70 after a recovery move as the risk aversion theme has improved the appeal for safe-haven assets.
S&P500 futures have reported losses in the Asian session ahead of the opening of the equity markets in the United States after an extended weekend. The weekend was full of geopolitical tensions including the US-China tensions and missile attacks by North Korea near Japan’s Essential Economic Zone (EEC) region. The demand for US government bonds has also dropped, which has led to a jump in the 10-year yields to 3.86%.
Going forward, the release of the Eurozone ZEW Survey- Economic Sentiment will be keenly watched. The sentiment data is seen as negative at 29.7 vs. the positive figure of 16.7 released earlier. A pessimist view from the majority of institutional investors could impact the Euro ahead.
The reason behind the pessimist view of institutional investors could be the hawkish stance on interest rates by the European Central Bank (ECB) President Christine Lagarde and other policymakers. On Monday, ECB Governing Council member Olli Rehn cited “It would be appropriate for the European Central Bank to raise rates beyond March and reach the terminal rate this summer,” as reported by Reuters. He further added that Eurozone may avoid recession and the growth will be around 1%.
Technical Levels: Supports and Resistances
EURUSD currently trading at 1.0664 at the time of writing. Pair opened at 1.0685 and is trading with a change of -0.2 % .
| Overview | Overview.1 | |
|---|---|---|
| 0 | Today last price | 1.0664 |
| 1 | Today Daily Change | -0.0021 |
| 2 | Today Daily Change % | -0.2000 |
| 3 | Today daily open | 1.0685 |
The pair is trading below its 20 Daily moving average @ 1.0788, below its 50 Daily moving average @ 1.0728 , above its 100 Daily moving average @ 1.0421 and above its 200 Daily moving average @ 1.033
| Trends | Trends.1 | |
|---|---|---|
| 0 | Daily SMA20 | 1.0788 |
| 1 | Daily SMA50 | 1.0728 |
| 2 | Daily SMA100 | 1.0421 |
| 3 | Daily SMA200 | 1.0330 |
The previous day high was 1.0705 while the previous day low was 1.067. The daily 38.2% Fib levels comes at 1.0683, expected to provide resistance. Similarly, the daily 61.8% fib level is at 1.0692, expected to provide resistance.
Note the levels of interest below:
- Pivot support is noted at 1.0668, 1.0652, 1.0634
- Pivot resistance is noted at 1.0703, 1.0721, 1.0737
| Levels | Levels.1 |
|---|---|
| Previous Daily High | 1.0705 |
| Previous Daily Low | 1.0670 |
| Previous Weekly High | 1.0805 |
| Previous Weekly Low | 1.0613 |
| Previous Monthly High | 1.0930 |
| Previous Monthly Low | 1.0483 |
| Daily Fibonacci 38.2% | 1.0683 |
| Daily Fibonacci 61.8% | 1.0692 |
| Daily Pivot Point S1 | 1.0668 |
| Daily Pivot Point S2 | 1.0652 |
| Daily Pivot Point S3 | 1.0634 |
| Daily Pivot Point R1 | 1.0703 |
| Daily Pivot Point R2 | 1.0721 |
| Daily Pivot Point R3 | 1.0737 |
[/s2If]
Join Our Telegram Group
")


