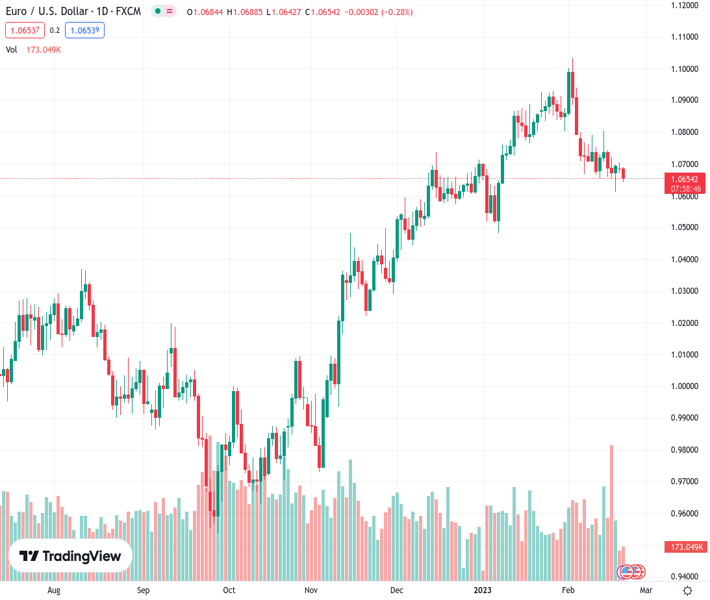
#EURUSD @ 1.06526 adds to Monday’s pullback, always below 1.0700. (Pivot Orderbook analysis)
…
This is a premium post.
[s2If !current_user_can(access_s2member_level4)]Please register for PREMIUM VERSION HERE to read full post below containing analysis. In case of any error or you think you are not able to read the full post below, please email us at support#nehcap.com [lwa][/s2If] [s2If current_user_can(access_s2member_level4)]
- EUR/USD adds to Monday’s pullback, always below 1.0700.
- Further weakness could retest the monthly low near 1.0610.
The pair currently trades last at 1.06526.
The previous day high was 1.0705 while the previous day low was 1.067. The daily 38.2% Fib levels comes at 1.0683, expected to provide resistance. Similarly, the daily 61.8% fib level is at 1.0692, expected to provide resistance.
EUR/USD keeps the side-lined theme well in place in the lower end of the range in the sub-1.0700 region so far on Tuesday.
If bears push harder, then the pair could confront the next support of note at the February low at 1.0612 (February 17). The breakdown of this level could prompt a potential test of the 2023 low at 1.0481 (January 6) to start shaping up in the short-term horizon.
So far, the bearish sentiment is expected to persist as long as the 3-month resistance line, today just beyond 1.0900 the figure, caps the upside.
In the longer run, the constructive view remains unchanged while above the 200-day SMA, today at 1.0328.
Technical Levels: Supports and Resistances
EURUSD currently trading at 1.0658 at the time of writing. Pair opened at 1.0685 and is trading with a change of -0.25 % .
| Overview | Overview.1 | |
|---|---|---|
| 0 | Today last price | 1.0658 |
| 1 | Today Daily Change | 46.0000 |
| 2 | Today Daily Change % | -0.2500 |
| 3 | Today daily open | 1.0685 |
The pair is trading below its 20 Daily moving average @ 1.0788, below its 50 Daily moving average @ 1.0728 , above its 100 Daily moving average @ 1.0421 and above its 200 Daily moving average @ 1.033
| Trends | Trends.1 | |
|---|---|---|
| 0 | Daily SMA20 | 1.0788 |
| 1 | Daily SMA50 | 1.0728 |
| 2 | Daily SMA100 | 1.0421 |
| 3 | Daily SMA200 | 1.0330 |
The previous day high was 1.0705 while the previous day low was 1.067. The daily 38.2% Fib levels comes at 1.0683, expected to provide resistance. Similarly, the daily 61.8% fib level is at 1.0692, expected to provide resistance.
Note the levels of interest below:
- Pivot support is noted at 1.0668, 1.0652, 1.0634
- Pivot resistance is noted at 1.0703, 1.0721, 1.0737
| Levels | Levels.1 |
|---|---|
| Previous Daily High | 1.0705 |
| Previous Daily Low | 1.0670 |
| Previous Weekly High | 1.0805 |
| Previous Weekly Low | 1.0613 |
| Previous Monthly High | 1.0930 |
| Previous Monthly Low | 1.0483 |
| Daily Fibonacci 38.2% | 1.0683 |
| Daily Fibonacci 61.8% | 1.0692 |
| Daily Pivot Point S1 | 1.0668 |
| Daily Pivot Point S2 | 1.0652 |
| Daily Pivot Point S3 | 1.0634 |
| Daily Pivot Point R1 | 1.0703 |
| Daily Pivot Point R2 | 1.0721 |
| Daily Pivot Point R3 | 1.0737 |
[/s2If]
Join Our Telegram Group
")


