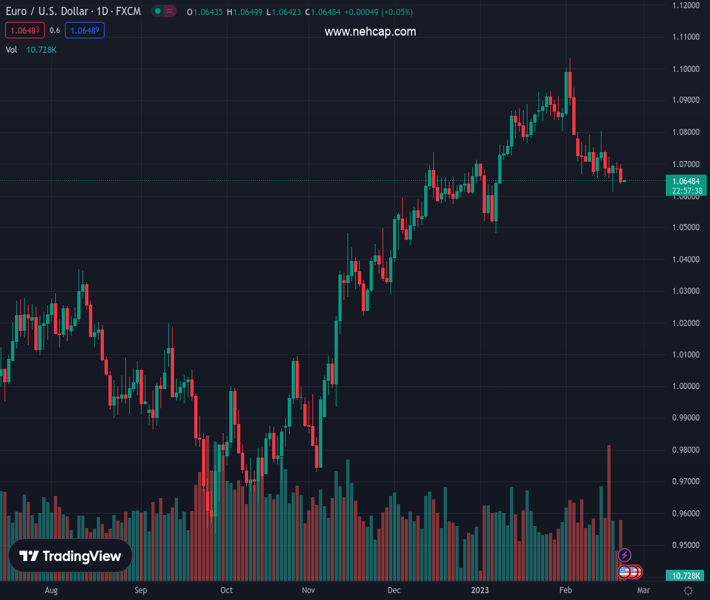
#EURUSD @ 1.06476 is continuously facing selling pressure from 61.8% Fibo retracement around 1.0700. (Pivot Orderbook analysis)
…
This is a premium post.
[s2If !current_user_can(access_s2member_level4)]Please register for PREMIUM VERSION HERE to read full post below containing analysis. In case of any error or you think you are not able to read the full post below, please email us at support#nehcap.com [lwa][/s2If] [s2If current_user_can(access_s2member_level4)]
- EUR/USD is continuously facing selling pressure from 61.8% Fibo retracement around 1.0700.
- The 89-period (High-Low) SMA band is barricading the Euro consistently.
- A slippage by the RSI (14) into the bearish range of 20.00-40.00 will trigger a downside momentum
The pair currently trades last at 1.06476.
The previous day high was 1.0705 while the previous day low was 1.067. The daily 38.2% Fib levels comes at 1.0683, expected to provide resistance. Similarly, the daily 61.8% fib level is at 1.0692, expected to provide resistance.
The EUR/USD pair has retreated after facing selling interest around 1.0650 in the early Tokyo session. The major currency pair remained extremely volatile as upbeat United States preliminary S&P PMI data resulted in accelerating odds for the continuation of the policy tightening spell by the Federal Reserve (Fed).
Risk-perceived assets like S&P500 witnessed a vertical sell-off as upbeat US PMI data strengthened recession fears. The Fed is going to consider the rebound in the scale of economic activities as a threat to the declining trend in the Consumer Price Index (CPI), which will be addressed by more rate hikes. This pushed the alpha provided on the 10-year US Treasury bonds to 4%.
Meanwhile, the upbeat Eurozone ZEW Survey- Economic Sentiment failed to provide support to the Euro. Higher-than-anticipated sentiment data indicates that the majority of institutional investors are holding an optimistic view on the economic projections.
The presence of potential sellers at the 61.8% Fibonacci retracement (placed from January 6 low at 1.0483 to February high at 1.1033) at 1.0693 is heavily deploying pressure on EUR/USD. This could drag the shared currency pair further.
The 89-period (High-Low) Simple Moving Average (SMA) band is barricading the Euro consistently.
Meanwhile, the Relative Strength Index (RSI) (14) is on the verge of slipping into the bearish range of 20.00-40.00. An occurrence of the same will trigger a downside momentum.
A decisive downside move below February 17 low at 1.0613 will drag the asset toward December 22 low at 1.0573. A slippage below the latter will extend the downside toward January 6 low at 1.0483.
In an alternate scenario, a break above February 16 high at 1.0722 will drive the asset toward 50% Fibo retracement at 1.0758, followed by February 14 high around 1.0800.
Technical Levels: Supports and Resistances
EURUSD currently trading at 1.0648 at the time of writing. Pair opened at 1.0685 and is trading with a change of -0.35 % .
| Overview | Overview.1 | |
|---|---|---|
| 0 | Today last price | 1.0648 |
| 1 | Today Daily Change | -0.0037 |
| 2 | Today Daily Change % | -0.3500 |
| 3 | Today daily open | 1.0685 |
The pair is trading below its 20 Daily moving average @ 1.0788, below its 50 Daily moving average @ 1.0728 , above its 100 Daily moving average @ 1.0421 and above its 200 Daily moving average @ 1.033
| Trends | Trends.1 | |
|---|---|---|
| 0 | Daily SMA20 | 1.0788 |
| 1 | Daily SMA50 | 1.0728 |
| 2 | Daily SMA100 | 1.0421 |
| 3 | Daily SMA200 | 1.0330 |
The previous day high was 1.0705 while the previous day low was 1.067. The daily 38.2% Fib levels comes at 1.0683, expected to provide resistance. Similarly, the daily 61.8% fib level is at 1.0692, expected to provide resistance.
Note the levels of interest below:
- Pivot support is noted at 1.0668, 1.0652, 1.0634
- Pivot resistance is noted at 1.0703, 1.0721, 1.0737
| Levels | Levels.1 |
|---|---|
| Previous Daily High | 1.0705 |
| Previous Daily Low | 1.0670 |
| Previous Weekly High | 1.0805 |
| Previous Weekly Low | 1.0613 |
| Previous Monthly High | 1.0930 |
| Previous Monthly Low | 1.0483 |
| Daily Fibonacci 38.2% | 1.0683 |
| Daily Fibonacci 61.8% | 1.0692 |
| Daily Pivot Point S1 | 1.0668 |
| Daily Pivot Point S2 | 1.0652 |
| Daily Pivot Point S3 | 1.0634 |
| Daily Pivot Point R1 | 1.0703 |
| Daily Pivot Point R2 | 1.0721 |
| Daily Pivot Point R3 | 1.0737 |
[/s2If]
Join Our Telegram Group
")


