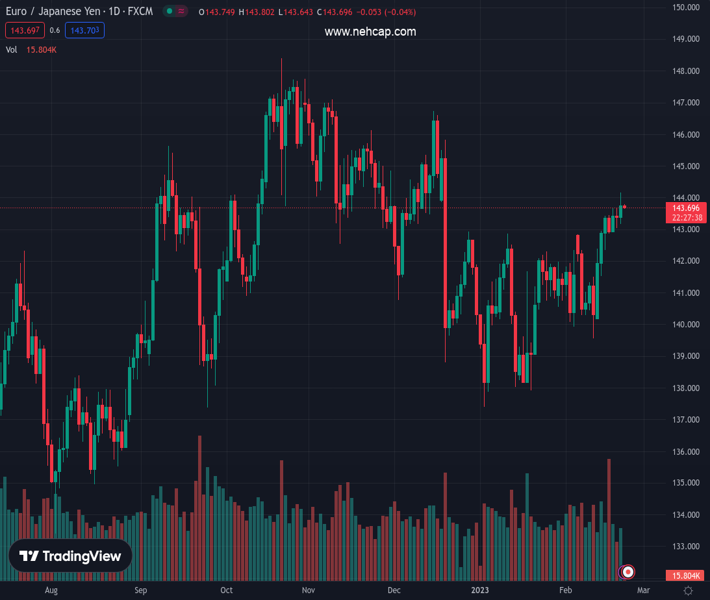
#EURJPY @ 143.689 hit a new YTD high, though it dived back below 144.00. (Pivot Orderbook analysis)
…
This is a premium post.
[s2If !current_user_can(access_s2member_level4)]Please register for PREMIUM VERSION HERE to read full post below containing analysis. In case of any error or you think you are not able to read the full post below, please email us at support#nehcap.com [lwa][/s2If] [s2If current_user_can(access_s2member_level4)]
- EUR/JPY hit a new YTD high, though it dived back below 144.00.
- EUR/JPY Price Analysis: Rejected at 144.00, it could fall back towards 142.50s.
The pair currently trades last at 143.689.
The previous day high was 143.66 while the previous day low was 143.03. The daily 38.2% Fib levels comes at 143.27, expected to provide support. Similarly, the daily 61.8% fib level is at 143.42, expected to provide support.
The EUR/JPY hit a fresh year-to-date (YTD) high at 144.16 on Tuesday, closing the session with gains of 0.26%. However, as Wednesday’s Asian Pacific session begins, the EUR/JPY exchanges hands at 143.70, below its opening price by a minuscule 0.03%.
During the last six days, the EUR/JPY was trading sideways, within 142.90-143.60, trapped, although the daily Exponential Moving Averages (EMAs) were resting below the price action. Even though the EUR/JPY pierced 144.00, failure to hold above the latter could exacerbate a re-test of 143.00, as bears take a respite.
The Relative Strength Index (RSI) is still in bullish territory, but its slope turned flat. While the Rate of Change (RoC), suggests that buying pressure is fading.
From an intraday perspective, the EUR/JPY 4-hour chart portrays the pair fluctuating at around Wednesday’s daily pivot point. Albeit the EUR/JPY has managed to extend its gains, the Relative Strength Index (RSI) suggests the cross would advance steadily instead of rallying sharply, which opens the door for a reversal.
The EUR/JPY first resistance would be 144.00. A breach of the latter will expose the R1 daily pivot at 144.21, followed by a downslope trendline that passes around 144.40, ahead of the R2 pivot point at 144.68. Once broken, the EUR/JPY can get to 145.00.
As an alternate scenario, the EUR/JPY first support would be the 20-EMA at 143.40, followed by the S1 daily pivot at 143.22. the next line of defense for EUR/JPY bulls would be the psychological 143.00 figure.
Technical Levels: Supports and Resistances
EURJPY currently trading at 143.74 at the time of writing. Pair opened at 143.45 and is trading with a change of 0.2 % .
| Overview | Overview.1 | |
|---|---|---|
| 0 | Today last price | 143.74 |
| 1 | Today Daily Change | 0.29 |
| 2 | Today Daily Change % | 0.20 |
| 3 | Today daily open | 143.45 |
The pair remains strongly bullish on the daily timeframe. It trades above its 20 SMA @ 141.8, 50 SMA 141.46, 100 SMA @ 143.1 and 200 SMA @ 141.3.
| Trends | Trends.1 | |
|---|---|---|
| 0 | Daily SMA20 | 141.80 |
| 1 | Daily SMA50 | 141.46 |
| 2 | Daily SMA100 | 143.10 |
| 3 | Daily SMA200 | 141.30 |
The previous day high was 143.66 while the previous day low was 143.03. The daily 38.2% Fib levels comes at 143.27, expected to provide support. Similarly, the daily 61.8% fib level is at 143.42, expected to provide support.
Note the levels of interest below:
- Pivot support is noted at 143.1, 142.75, 142.48
- Pivot resistance is noted at 143.73, 144.0, 144.35
| Levels | Levels.1 |
|---|---|
| Previous Daily High | 143.66 |
| Previous Daily Low | 143.03 |
| Previous Weekly High | 143.67 |
| Previous Weekly Low | 140.19 |
| Previous Monthly High | 142.86 |
| Previous Monthly Low | 137.39 |
| Daily Fibonacci 38.2% | 143.27 |
| Daily Fibonacci 61.8% | 143.42 |
| Daily Pivot Point S1 | 143.10 |
| Daily Pivot Point S2 | 142.75 |
| Daily Pivot Point S3 | 142.48 |
| Daily Pivot Point R1 | 143.73 |
| Daily Pivot Point R2 | 144.00 |
| Daily Pivot Point R3 | 144.35 |
[/s2If]
Join Our Telegram Group
")


