#AUDUSD @ 0.69041 picks up bids to extend the bounce off intraday low on RBA Minutes. (Pivot Orderbook analysis)
…
This is a premium post.
[s2If !current_user_can(access_s2member_level4)]Please register for PREMIUM VERSION HERE to read full post below containing analysis. In case of any error or you think you are not able to read the full post below, please email us at support#nehcap.com [lwa][/s2If] [s2If current_user_can(access_s2member_level4)]
- AUD/USD picks up bids to extend the bounce off intraday low on RBA Minutes.
- RBA Minutes reject speculations favoring a pause in the rate hikes in February.
- Mixed sentiment, full markets may probe bulls ahead of US PMIs for February.
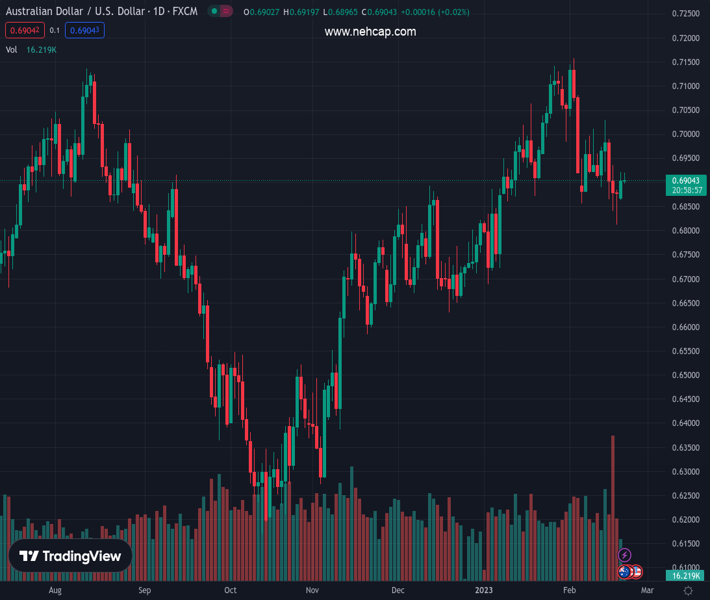
The pair currently trades last at 0.69041.
The previous day high was 0.6921 while the previous day low was 0.6862. The daily 38.2% Fib levels comes at 0.6898, expected to provide support. Similarly, the daily 61.8% fib level is at 0.6885, expected to provide support.
AUD/USD picks up bids to reverse initial Asian session losses to 0.6910, taking a U-turn from the intraday low to refresh the daily top near 0.6920, as the Reserve Bank of Australia (RBA) rules out dovish hopes on early Tuesday. In doing so, the Aussie pair also marks a late reaction to Australia’s activity data for February. However, the cautious mood ahead of the first readings for the US February PMIs and the return of the full markets seem to probe the traders of late.
The latest RBA Meeting Minutes signaled that the monetary policy board a hike of 25 basis points (bps) or 50bp but not discussed a pause in the rate hikes.
Also read: RBA minutes: The board agreed that additional rate hikes were likely in the coming months
Earlier in the day, Australia’s preliminary readings of the S&P Global PMIs for February came in firmer as Manufacturing PMI rose to 50.1, versus 49.9 expected and 50.0 prior while the Services PMI increased to 49.2 from 48.6 previous readings and 48.4 market forecasts. Further, the S&P Global Composite PMI also improved to 49.2 from 48.5.
It should be noted that the cautious sentiment on the return of the full markets and geopolitical fears surrounding China and North Korea seem to probe the AUD/USD bulls. On the same line could be the hawkish bias about the Fed and the recently firmer US Treasury bond yields, which put a floor under the US Dollar.
Recently, the US and China alleged each other over the balloon shooting whereas the US diplomatic ties with Taiwan teased Beijing. On the same line, the United Nations (UN) Security Council is alarmed by Japan for North Korea’s missile testing and the same weigh on the sentiment, as well as the AUD/USD price.
While portraying the mood, S&P 500 Futures print mild losses near 4,075 amid sluggish US 10-year Treasury bond yields. Even so, the benchmark US bond coupons are near the highest levels marked since early November 2022.
Should the scheduled US PMIs appear firmer than what marked in January, also manage to cross the 50.0 mark despite unimpressive expectations, the odds of witnessing further US Dollar strength and the AUD/USD weakness can’t be ruled out.
Unless breaking the the 200-DMA, around 0.6800 by the press time, AUD/USD remains on the way to a 13-day-old resistance line, close to 0.6950 at the latest.
Technical Levels: Supports and Resistances
AUDUSD currently trading at 0.6906 at the time of writing. Pair opened at 0.6913 and is trading with a change of -0.10% % .
| Overview | Overview.1 | |
|---|---|---|
| 0 | Today last price | 0.6906 |
| 1 | Today Daily Change | -0.0007 |
| 2 | Today Daily Change % | -0.10% |
| 3 | Today daily open | 0.6913 |
The pair is trading below its 20 Daily moving average @ 0.6989, above its 50 Daily moving average @ 0.6891 , above its 100 Daily moving average @ 0.6711 and above its 200 Daily moving average @ 0.6805
| Trends | Trends.1 | |
|---|---|---|
| 0 | Daily SMA20 | 0.6989 |
| 1 | Daily SMA50 | 0.6891 |
| 2 | Daily SMA100 | 0.6711 |
| 3 | Daily SMA200 | 0.6805 |
The previous day high was 0.6921 while the previous day low was 0.6862. The daily 38.2% Fib levels comes at 0.6898, expected to provide support. Similarly, the daily 61.8% fib level is at 0.6885, expected to provide support.
Note the levels of interest below:
- Pivot support is noted at 0.6877, 0.6841, 0.6819
- Pivot resistance is noted at 0.6935, 0.6957, 0.6993
| Levels | Levels.1 |
|---|---|
| Previous Daily High | 0.6921 |
| Previous Daily Low | 0.6862 |
| Previous Weekly High | 0.7030 |
| Previous Weekly Low | 0.6812 |
| Previous Monthly High | 0.7143 |
| Previous Monthly Low | 0.6688 |
| Daily Fibonacci 38.2% | 0.6898 |
| Daily Fibonacci 61.8% | 0.6885 |
| Daily Pivot Point S1 | 0.6877 |
| Daily Pivot Point S2 | 0.6841 |
| Daily Pivot Point S3 | 0.6819 |
| Daily Pivot Point R1 | 0.6935 |
| Daily Pivot Point R2 | 0.6957 |
| Daily Pivot Point R3 | 0.6993 |
[/s2If]
Join Our Telegram Group
")


